Estimated Value: $381,000 - $417,000
4
Beds
2
Baths
1,879
Sq Ft
$214/Sq Ft
Est. Value
About This Home
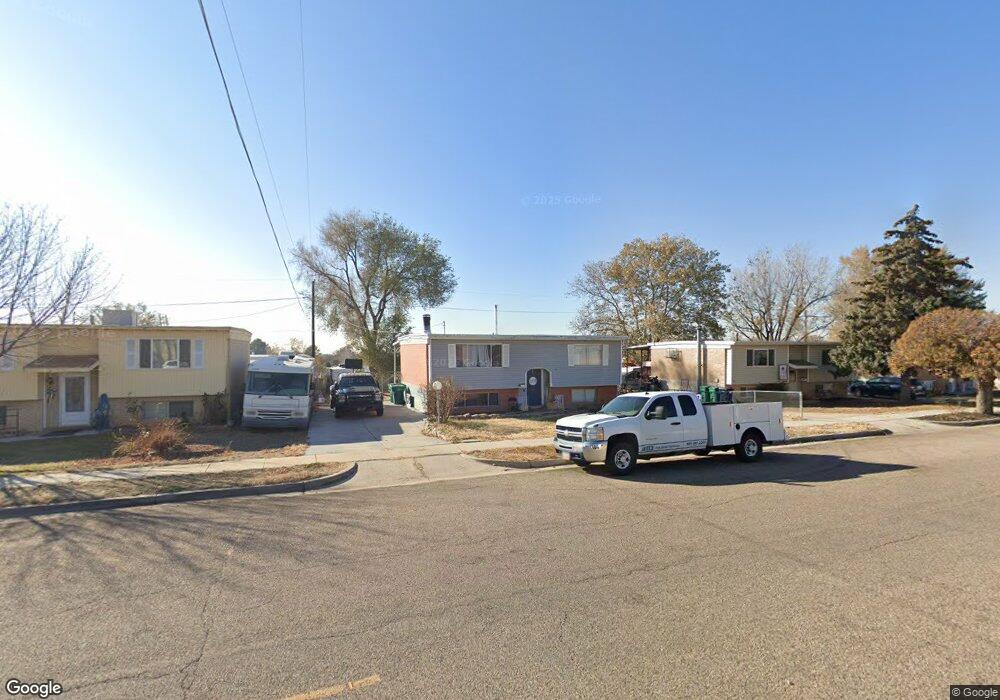
This home is located at 5331 S 2675 W, Roy, UT 84067 and is currently estimated at $401,750, approximately $213 per square foot. 5331 S 2675 W is a home located in Weber County with nearby schools including Lakeview Elementary School, Roy Junior High School, and Roy High School.
Ownership History
Date
Name
Owned For
Owner Type
Purchase Details
Closed on
Apr 10, 2018
Sold by
Lee Matthew
Bought by
Allred Kyle
Current Estimated Value
Home Financials for this Owner
Home Financials are based on the most recent Mortgage that was taken out on this home.
Original Mortgage
$7,850
Outstanding Balance
$6,754
Interest Rate
4.46%
Mortgage Type
Stand Alone Second
Estimated Equity
$394,996
Purchase Details
Closed on
Apr 7, 2018
Sold by
Allred Kyle S
Bought by
Allred Kyle S and Allred Tiffani
Home Financials for this Owner
Home Financials are based on the most recent Mortgage that was taken out on this home.
Original Mortgage
$7,850
Outstanding Balance
$6,754
Interest Rate
4.46%
Mortgage Type
Stand Alone Second
Estimated Equity
$394,996
Purchase Details
Closed on
Jun 23, 2015
Sold by
Griffith Marlin and Griffith Judy L
Bought by
Lee Matthew
Purchase Details
Closed on
Oct 29, 2009
Sold by
Griffith Marlin
Bought by
Griffith Marlin and Griffith Adam Phillip
Create a Home Valuation Report for This Property
The Home Valuation Report is an in-depth analysis detailing your home's value as well as a comparison with similar homes in the area
Home Values in the Area
Average Home Value in this Area
Purchase History
| Date | Buyer | Sale Price | Title Company |
|---|---|---|---|
| Allred Kyle | -- | Founders Title Co Layton | |
| Allred Kyle S | -- | Gateway Tltle Ins Agcy L | |
| Lee Matthew | -- | None Available | |
| Griffith Marlin | -- | Accommodation |
Source: Public Records
Mortgage History
| Date | Status | Borrower | Loan Amount |
|---|---|---|---|
| Open | Allred Kyle | $7,850 | |
| Open | Allred Kyle S | $223,100 |
Source: Public Records
Tax History
| Year | Tax Paid | Tax Assessment Tax Assessment Total Assessment is a certain percentage of the fair market value that is determined by local assessors to be the total taxable value of land and additions on the property. | Land | Improvement |
|---|---|---|---|---|
| 2025 | $2,492 | $391,687 | $117,426 | $274,261 |
| 2024 | $2,432 | $211,749 | $64,585 | $147,164 |
| 2023 | $2,268 | $196,900 | $61,132 | $135,768 |
| 2022 | $2,376 | $213,400 | $52,754 | $160,646 |
| 2021 | $1,865 | $273,000 | $67,656 | $205,344 |
| 2020 | $1,755 | $236,000 | $67,656 | $168,344 |
| 2019 | $1,643 | $207,000 | $41,036 | $165,964 |
| 2018 | $1,334 | $154,000 | $37,178 | $116,822 |
| 2017 | $1,401 | $153,716 | $37,178 | $116,538 |
| 2016 | $1,237 | $71,836 | $18,234 | $53,602 |
| 2015 | $1,121 | $66,054 | $15,632 | $50,422 |
| 2014 | $1,130 | $66,054 | $15,632 | $50,422 |
Source: Public Records
Map
Nearby Homes
Your Personal Tour Guide
Ask me questions while you tour the home.