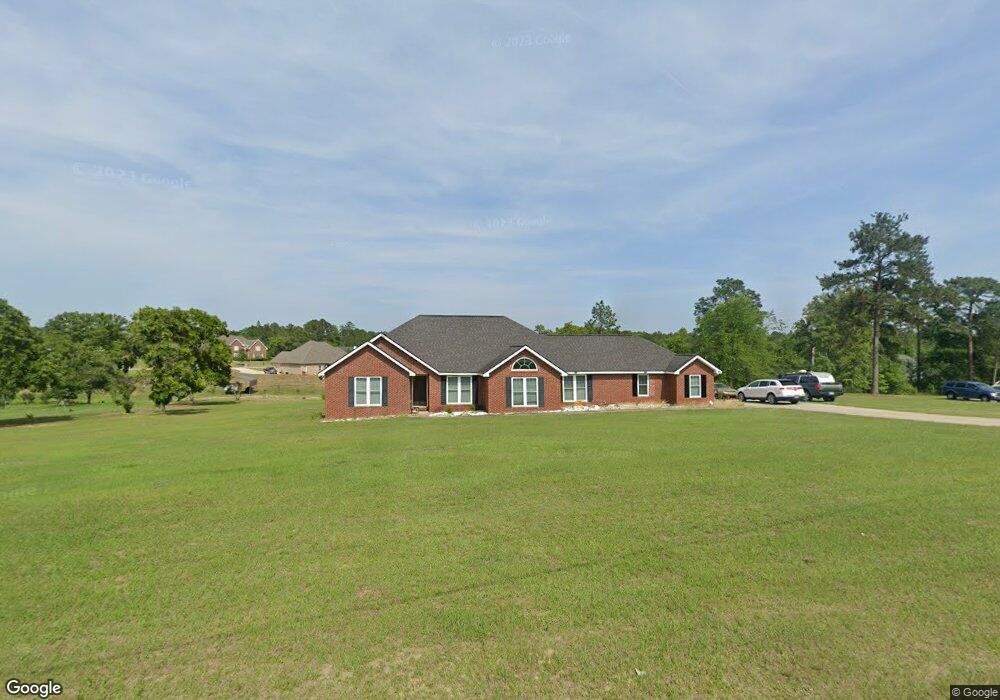
5331 Sand Hill Cir E Lizella, GA 31052
Estimated Value: $314,000 - $329,000
3
Beds
3
Baths
2,489
Sq Ft
$129/Sq Ft
Est. Value
About This Home
This home is located at 5331 Sand Hill Cir E, Lizella, GA 31052 and is currently estimated at $321,263, approximately $129 per square foot. 5331 Sand Hill Cir E is a home located in Bibb County with nearby schools including Skyview Elementary School, Rutland Middle School, and Rutland High School.
Ownership History
Date
Name
Owned For
Owner Type
Purchase Details
Closed on
Jun 11, 2014
Sold by
Bloodsaw Marjorie J
Bought by
Bloodsaw Marjorie J and Bloodsaw Walter T
Current Estimated Value
Purchase Details
Closed on
Jun 29, 2011
Sold by
May Fannie
Bought by
Bloodsaw Marjorie J
Purchase Details
Closed on
Nov 2, 2010
Sold by
Suntrust Mortgage Inc
Bought by
Federal National Mortgage Association
Purchase Details
Closed on
Jun 8, 2007
Sold by
The Parkland Corp
Bought by
Green Anthony E
Home Financials for this Owner
Home Financials are based on the most recent Mortgage that was taken out on this home.
Original Mortgage
$253,400
Interest Rate
6.16%
Mortgage Type
Unknown
Purchase Details
Closed on
Nov 17, 2006
Sold by
The Parkland Corp
Bought by
Regions Bank
Purchase Details
Closed on
Oct 30, 2006
Sold by
Lamar Tracy
Bought by
Lamar Gregroy
Create a Home Valuation Report for This Property
The Home Valuation Report is an in-depth analysis detailing your home's value as well as a comparison with similar homes in the area
Home Values in the Area
Average Home Value in this Area
Purchase History
| Date | Buyer | Sale Price | Title Company |
|---|---|---|---|
| Bloodsaw Marjorie J | -- | None Available | |
| Bloodsaw Marjorie J | -- | None Available | |
| Federal National Mortgage Association | $210,300 | -- | |
| Federal National Mortgage Association | $210,275 | None Available | |
| Suntrust Mortgage Inc | $210,274 | None Available | |
| Green Anthony E | $253,400 | None Available | |
| Regions Bank | $141,498 | None Avilabale | |
| The Parkland Corp | $209,900 | None Avilebel | |
| Lamar Gregroy | -- | None Available |
Source: Public Records
Mortgage History
| Date | Status | Borrower | Loan Amount |
|---|---|---|---|
| Previous Owner | Green Anthony E | $253,400 |
Source: Public Records
Tax History Compared to Growth
Tax History
| Year | Tax Paid | Tax Assessment Tax Assessment Total Assessment is a certain percentage of the fair market value that is determined by local assessors to be the total taxable value of land and additions on the property. | Land | Improvement |
|---|---|---|---|---|
| 2024 | -- | $104,824 | $7,200 | $97,624 |
| 2023 | $0 | $87,763 | $7,200 | $80,563 |
| 2022 | $3,008 | $79,169 | $8,200 | $70,969 |
| 2021 | $3,008 | $79,169 | $8,200 | $70,969 |
| 2020 | $3,164 | $79,169 | $8,200 | $70,969 |
| 2019 | $2,036 | $79,169 | $8,200 | $70,969 |
| 2018 | $120 | $62,471 | $8,200 | $54,271 |
| 2017 | $2,015 | $61,807 | $8,200 | $53,607 |
| 2016 | $0 | $61,807 | $8,200 | $53,607 |
| 2015 | -- | $61,807 | $8,200 | $53,607 |
| 2014 | $3,031 | $61,807 | $8,200 | $53,607 |
Source: Public Records
Map
Nearby Homes
- 7135 Bethel Church Rd
- 6403 Pine Bloom Place
- 4360 Chant Ct
- 6100 Clayts Cir
- 6219 Clayts Cir
- 218 Jason Way
- 6982 Knoxville Rd
- 6866 Knoxville Rd
- 215 Little Hickory Dr
- 6408 Michael Dr
- 229 Briar Creek Way
- 142 Tobee Dr
- 169 Doublegate Dr
- 173 Doublegate Dr
- 177 Doublegate Dr
- 181 Doublegate Dr
- 4456 Fulton Mill Rd
- 3636 W Point Cir
- 5335 Sand Hill Cir E
- 5327 Sand Hill Cir E
- 8006 Skyler Ct
- 7001 Sandusky Dr
- 7000 Sandusky Dr
- 6510 Yellowstone Way
- 8012 Skyler Ct
- 6504 Yellowstone Way
- 6502 Yellowstone Way
- 5158 Sand Hill Cir N
- 6514 Yellowstone Way
- 5154 Sand Hill Cir
- 6498 Yellowstone Way
- 6518 Yellowstone Way
- 7005 Sandusky Dr
- 0 Skyler Ct Unit 8720715
- 0 Skyler Ct
- 7004 Sandusky Dr
- 8016 Skyler Ct
- 5162 Sand Hill Cir N