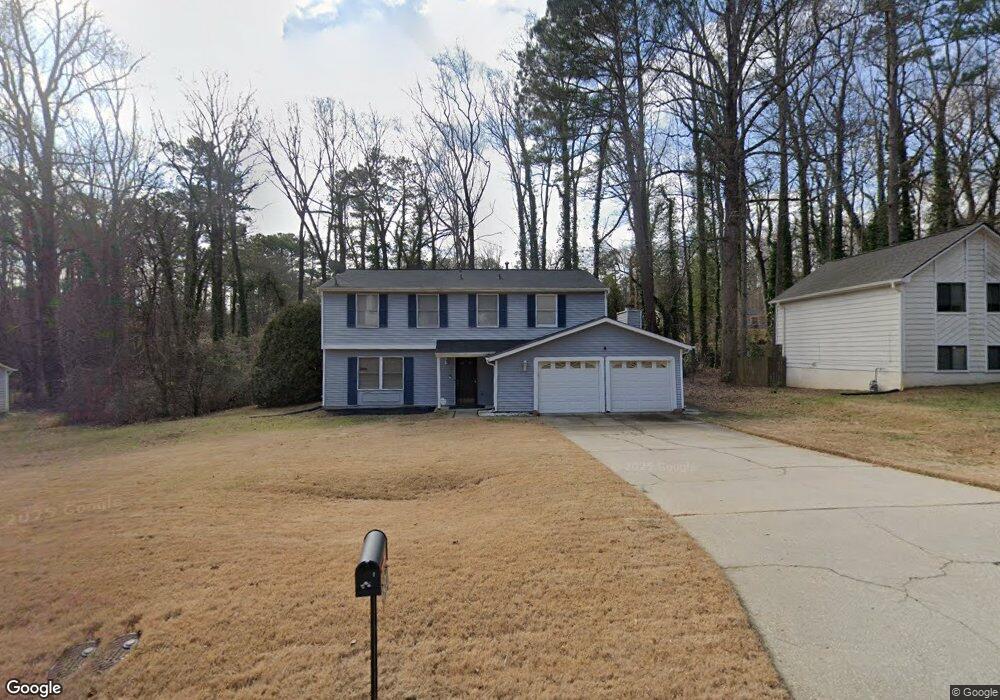
5331 Winslow Crossing Lithonia, GA 30038
Estimated Value: $236,000 - $287,000
4
Beds
3
Baths
2,120
Sq Ft
$124/Sq Ft
Est. Value
About This Home
This home is located at 5331 Winslow Crossing, Lithonia, GA 30038 and is currently estimated at $263,403, approximately $124 per square foot. 5331 Winslow Crossing is a home located in DeKalb County with nearby schools including Flat Rock Elementary School, Salem Middle School, and Martin Luther King- Jr. High School.
Ownership History
Date
Name
Owned For
Owner Type
Purchase Details
Closed on
Jul 17, 2008
Sold by
Us Bk Na 2006-He3
Bought by
Brooks Donald E
Current Estimated Value
Home Financials for this Owner
Home Financials are based on the most recent Mortgage that was taken out on this home.
Original Mortgage
$64,175
Outstanding Balance
$41,819
Interest Rate
6.27%
Mortgage Type
New Conventional
Estimated Equity
$221,584
Purchase Details
Closed on
Apr 1, 2008
Sold by
Orokunle David and Orokunle Janet
Bought by
Citigroup Global 2006-He3
Purchase Details
Closed on
May 22, 2000
Sold by
Washington Luther B and Washington Willie J
Bought by
Orokunle David and Orokunle Janet
Home Financials for this Owner
Home Financials are based on the most recent Mortgage that was taken out on this home.
Original Mortgage
$107,100
Interest Rate
11.75%
Mortgage Type
New Conventional
Create a Home Valuation Report for This Property
The Home Valuation Report is an in-depth analysis detailing your home's value as well as a comparison with similar homes in the area
Home Values in the Area
Average Home Value in this Area
Purchase History
| Date | Buyer | Sale Price | Title Company |
|---|---|---|---|
| Brooks Donald E | $75,500 | -- | |
| Citigroup Global 2006-He3 | $100,000 | -- | |
| Orokunle David | $119,000 | -- |
Source: Public Records
Mortgage History
| Date | Status | Borrower | Loan Amount |
|---|---|---|---|
| Open | Brooks Donald E | $64,175 | |
| Previous Owner | Orokunle David | $107,100 |
Source: Public Records
Tax History Compared to Growth
Tax History
| Year | Tax Paid | Tax Assessment Tax Assessment Total Assessment is a certain percentage of the fair market value that is determined by local assessors to be the total taxable value of land and additions on the property. | Land | Improvement |
|---|---|---|---|---|
| 2025 | $3,160 | $112,480 | $16,000 | $96,480 |
| 2024 | $3,139 | $109,080 | $16,000 | $93,080 |
| 2023 | $3,139 | $108,840 | $16,000 | $92,840 |
| 2022 | $2,537 | $87,360 | $4,920 | $82,440 |
| 2021 | $1,967 | $61,600 | $4,920 | $56,680 |
| 2020 | $1,936 | $60,880 | $4,920 | $55,960 |
| 2019 | $1,691 | $50,720 | $4,920 | $45,800 |
| 2018 | $1,434 | $50,720 | $4,920 | $45,800 |
| 2017 | $1,356 | $39,680 | $4,920 | $34,760 |
| 2016 | $957 | $29,040 | $4,920 | $24,120 |
| 2014 | $882 | $26,760 | $4,920 | $21,840 |
Source: Public Records
Map
Nearby Homes
- 5364 Winslow Crossing
- 5515 Rock Springs Rd
- 3274 Adelade Ct
- 5437 Winslow Crossing N
- 5600 Rock Springs Rd
- 5436 Brisbane Ct Unit 1
- 5360 Tasman Trail
- 3309 Panola Rd
- 3248 Brisbane Way
- 3340 Fannin Ct
- 4923 Panola Mill Dr
- 5536 La Fleur Trail
- 3026 Highland Park Ln Unit II
- 3255 Hunters Crossing Point
- 3027 Fair Creek Ct
- 5614 Regency Forest Ct
- 5415 Radford Ln
- 5585 Fairington Place
- 4995 Panola Mill Dr
- 5057 Panola Mill Dr
- 5339 Winslow Crossing
- 5323 Winslow Crossing
- 5228 Black Foot Dr
- 5234 Black Foot Dr
- 5347 Winslow Crossing
- 5332 Winslow Crossing
- 5317 Winslow Crossing
- 5324 Winslow Crossing
- 5340 Winslow Crossing
- 5238 Black Foot Dr
- 5316 Winslow Crossing
- 5348 Winslow Crossing
- 5355 Winslow Crossing
- 5309 Winslow Crossing
- 5212 Black Foot Dr
- 5339 Medena Way
- 5308 Winslow Crossing
- 5356 Winslow Crossing
- 5345 Medena Way
- 5363 Winslow Crossing