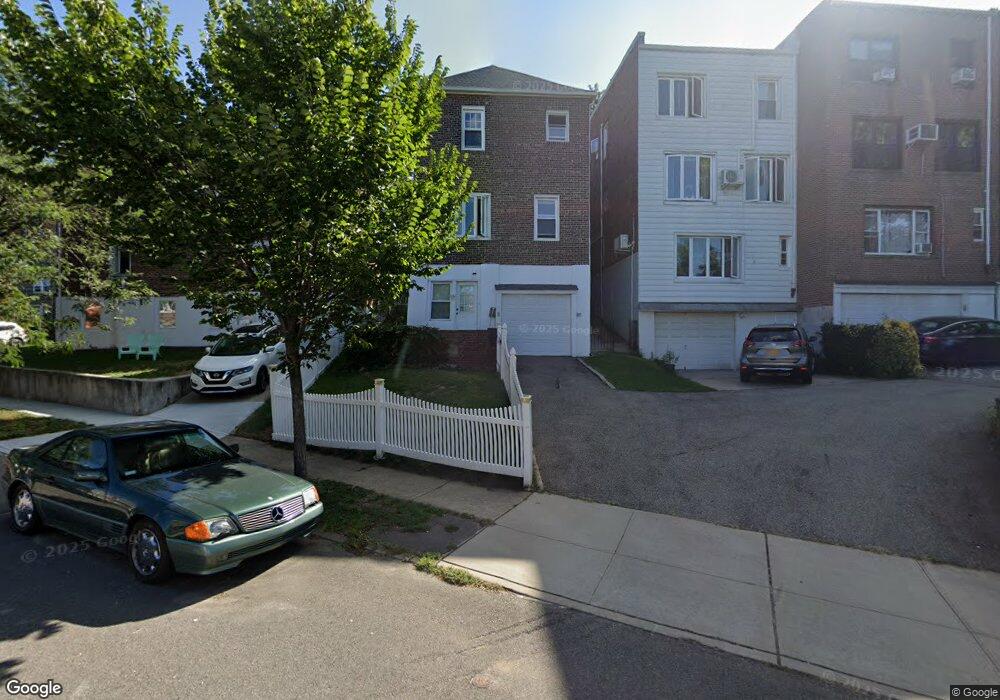
5332 64th St Maspeth, NY 11378
Maspeth NeighborhoodEstimated Value: $912,996 - $1,055,000
--
Bed
--
Bath
1,560
Sq Ft
$625/Sq Ft
Est. Value
About This Home
This home is located at 5332 64th St, Maspeth, NY 11378 and is currently estimated at $975,749, approximately $625 per square foot. 5332 64th St is a home located in Queens County with nearby schools including P.S. 229 Emanuel Kaplan, IS 73 - The Frank Sansivieri School, and Grover Cleveland High School.
Ownership History
Date
Name
Owned For
Owner Type
Purchase Details
Closed on
Jul 9, 2010
Sold by
Macaluso Christina and Macaluso Roger A
Bought by
Lynagh Anna Marie and Lynagh Michael
Current Estimated Value
Home Financials for this Owner
Home Financials are based on the most recent Mortgage that was taken out on this home.
Original Mortgage
$264,000
Outstanding Balance
$175,782
Interest Rate
4.76%
Mortgage Type
Purchase Money Mortgage
Estimated Equity
$799,967
Purchase Details
Closed on
Nov 17, 2005
Sold by
Kelly Dervilla and Kilraine Anne
Bought by
Macaluso Carmen and Macaluso Roger A
Home Financials for this Owner
Home Financials are based on the most recent Mortgage that was taken out on this home.
Original Mortgage
$359,000
Interest Rate
6.14%
Mortgage Type
Purchase Money Mortgage
Purchase Details
Closed on
Jun 8, 2000
Sold by
Mcbride Rosemarie
Bought by
Kelly Dervilla and Kilraine Anne
Home Financials for this Owner
Home Financials are based on the most recent Mortgage that was taken out on this home.
Original Mortgage
$242,000
Interest Rate
8.59%
Create a Home Valuation Report for This Property
The Home Valuation Report is an in-depth analysis detailing your home's value as well as a comparison with similar homes in the area
Home Values in the Area
Average Home Value in this Area
Purchase History
| Date | Buyer | Sale Price | Title Company |
|---|---|---|---|
| Lynagh Anna Marie | $544,000 | -- | |
| Macaluso Carmen | $563,000 | -- | |
| Kelly Dervilla | $302,500 | -- |
Source: Public Records
Mortgage History
| Date | Status | Borrower | Loan Amount |
|---|---|---|---|
| Open | Lynagh Anna Marie | $264,000 | |
| Previous Owner | Macaluso Carmen | $359,000 | |
| Previous Owner | Kelly Dervilla | $242,000 |
Source: Public Records
Tax History Compared to Growth
Tax History
| Year | Tax Paid | Tax Assessment Tax Assessment Total Assessment is a certain percentage of the fair market value that is determined by local assessors to be the total taxable value of land and additions on the property. | Land | Improvement |
|---|---|---|---|---|
| 2025 | $8,123 | $43,712 | $5,340 | $38,372 |
| 2024 | $8,135 | $41,843 | $5,252 | $36,591 |
| 2023 | $7,647 | $39,475 | $4,939 | $34,536 |
| 2022 | $7,148 | $58,500 | $7,440 | $51,060 |
| 2021 | $7,370 | $54,780 | $7,440 | $47,340 |
| 2020 | $7,415 | $52,320 | $7,440 | $44,880 |
| 2019 | $7,001 | $55,500 | $7,440 | $48,060 |
| 2018 | $6,408 | $32,896 | $5,417 | $27,479 |
| 2017 | $6,027 | $31,035 | $5,602 | $25,433 |
| 2016 | $5,759 | $31,035 | $5,602 | $25,433 |
| 2015 | $3,531 | $30,356 | $6,950 | $23,406 |
| 2014 | $3,531 | $29,058 | $7,428 | $21,630 |
Source: Public Records
Map
Nearby Homes
- 53-67 62nd St
- 62-15 53rd Ave Unit LGD
- 5307 65th Place
- 52-60 65th Place Unit 5E
- 53-24 66th St
- 53-36 66th St
- 52-24 65th Place Unit 3K
- 52-21 65th Place Unit 6P
- 53-26 61st St
- 5221 65th Place Unit 6N
- 5224 66th St
- 52-15 65th Place Unit 3A
- 52-15 65th Place Unit 2A
- 5428 65th Place
- 6319 Borden Ave
- 67-29 52nd Rd
- 6731 52nd Rd
- 51-17 64th St
- 5405 68th St
- 52-14 69th St