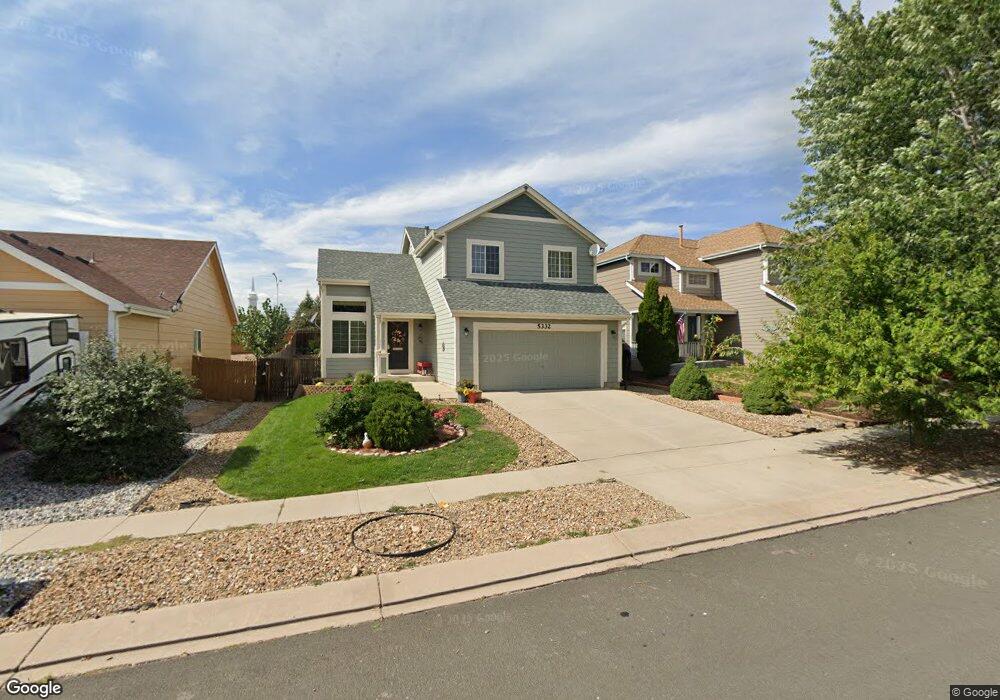
5332 Arroyo St Colorado Springs, CO 80922
Stetson Hills NeighborhoodEstimated Value: $423,668 - $442,000
3
Beds
4
Baths
1,386
Sq Ft
$312/Sq Ft
Est. Value
About This Home
This home is located at 5332 Arroyo St, Colorado Springs, CO 80922 and is currently estimated at $432,417, approximately $311 per square foot. 5332 Arroyo St is a home located in El Paso County with nearby schools including Stetson Elementary School, Skyview Middle School, and Sand Creek High School.
Ownership History
Date
Name
Owned For
Owner Type
Purchase Details
Closed on
Apr 6, 2012
Sold by
Bruneti Angelo
Bought by
Colgan Donna A
Current Estimated Value
Home Financials for this Owner
Home Financials are based on the most recent Mortgage that was taken out on this home.
Original Mortgage
$163,253
Outstanding Balance
$111,906
Interest Rate
3.75%
Mortgage Type
FHA
Estimated Equity
$320,511
Purchase Details
Closed on
Aug 26, 2006
Sold by
Bransky Salvatore E and Bransky Maritza
Bought by
Brunetti Nicholas L
Home Financials for this Owner
Home Financials are based on the most recent Mortgage that was taken out on this home.
Original Mortgage
$156,000
Interest Rate
6.79%
Mortgage Type
Unknown
Purchase Details
Closed on
Jul 2, 2002
Sold by
U S Home Corp
Bought by
Bransky Salvatore E and Bransky Maritza
Home Financials for this Owner
Home Financials are based on the most recent Mortgage that was taken out on this home.
Original Mortgage
$158,949
Interest Rate
6.6%
Mortgage Type
FHA
Create a Home Valuation Report for This Property
The Home Valuation Report is an in-depth analysis detailing your home's value as well as a comparison with similar homes in the area
Home Values in the Area
Average Home Value in this Area
Purchase History
| Date | Buyer | Sale Price | Title Company |
|---|---|---|---|
| Colgan Donna A | $167,500 | None Available | |
| Brunetti Nicholas L | $195,000 | Stewart Title Of Co Inc | |
| Bransky Salvatore E | $161,200 | -- |
Source: Public Records
Mortgage History
| Date | Status | Borrower | Loan Amount |
|---|---|---|---|
| Open | Colgan Donna A | $163,253 | |
| Previous Owner | Brunetti Nicholas L | $156,000 | |
| Previous Owner | Bransky Salvatore E | $158,949 |
Source: Public Records
Tax History Compared to Growth
Tax History
| Year | Tax Paid | Tax Assessment Tax Assessment Total Assessment is a certain percentage of the fair market value that is determined by local assessors to be the total taxable value of land and additions on the property. | Land | Improvement |
|---|---|---|---|---|
| 2025 | $1,681 | $30,400 | -- | -- |
| 2024 | $1,152 | $30,430 | $4,620 | $25,810 |
| 2023 | $1,152 | $30,430 | $4,620 | $25,810 |
| 2022 | $1,359 | $21,870 | $4,170 | $17,700 |
| 2021 | $1,416 | $22,500 | $4,290 | $18,210 |
| 2020 | $1,211 | $19,020 | $3,580 | $15,440 |
| 2019 | $1,198 | $19,020 | $3,580 | $15,440 |
| 2018 | $946 | $14,730 | $3,020 | $11,710 |
| 2017 | $950 | $14,730 | $3,020 | $11,710 |
| 2016 | $956 | $14,630 | $2,950 | $11,680 |
| 2015 | $957 | $14,630 | $2,950 | $11,680 |
| 2014 | $939 | $14,080 | $2,790 | $11,290 |
Source: Public Records
Map
Nearby Homes
- 5275 Belle Star Dr
- 5175 Stone Fence Dr
- 5307 Belle Star Dr
- 5225 Stone Fence Dr
- 5041 Weaver Dr
- 5359 Gentle Wind Rd
- 5315 War Paint Place
- 5412 Statute Dr
- 5465 War Paint Place
- 5715 Brennan Ave
- 7668 Amberly Dr
- 5739 Brennan Ave
- 7120 Highcroft Dr
- 7010 Highcroft Dr
- 5625 Dusty Chaps Dr
- 7340 Amberly Dr
- 6330 Emma Ln
- 7020 Hillbeck Dr
- 6185 Hearth Ct
- 6819 Barela Ct
- 5336 Arroyo St
- 5328 Arroyo St
- 5340 Arroyo St
- 5324 Arroyo St
- 5344 Arroyo St
- 5320 Arroyo St
- 5331 Arroyo St
- 5327 Arroyo St
- 5335 Arroyo St
- 5323 Arroyo St
- 5348 Arroyo St
- 5339 Arroyo St
- 5316 Arroyo St
- 5319 Arroyo St
- 5343 Arroyo St
- 5315 Arroyo St
- 5352 Arroyo St
- 5312 Arroyo St
- 5384 Cutgrass Ln
- 5347 Arroyo St