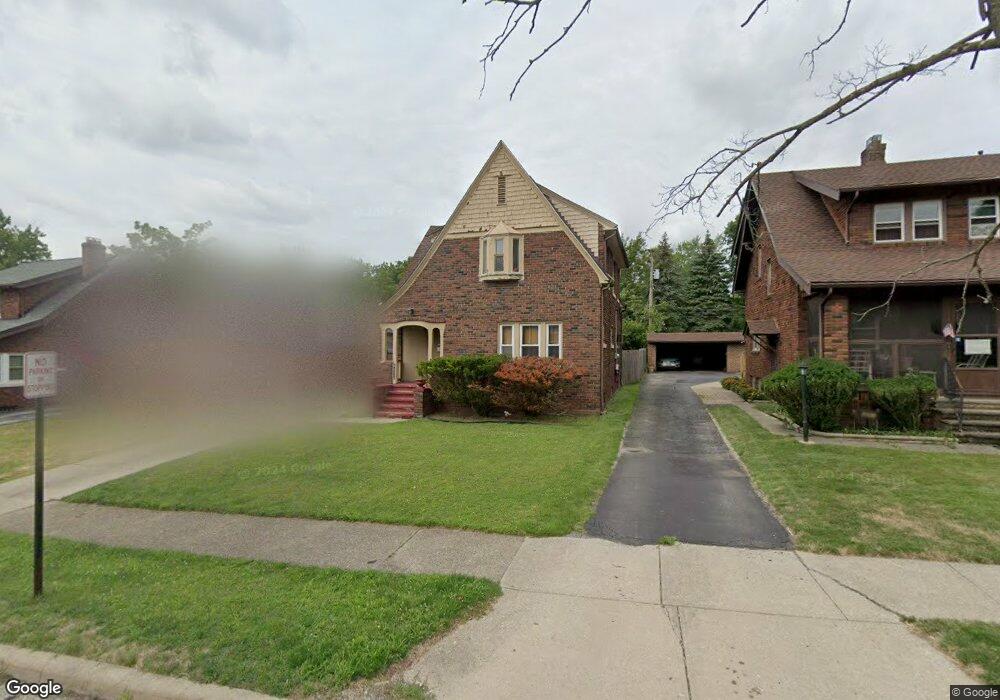
5332 Clement Ave Maple Heights, OH 44137
Estimated Value: $131,665 - $150,000
3
Beds
2
Baths
1,502
Sq Ft
$93/Sq Ft
Est. Value
About This Home
This home is located at 5332 Clement Ave, Maple Heights, OH 44137 and is currently estimated at $139,916, approximately $93 per square foot. 5332 Clement Ave is a home located in Cuyahoga County with nearby schools including Abraham Lincoln Elementary School, Rockside/ J.F. Kennedy School, and Barack Obama School.
Ownership History
Date
Name
Owned For
Owner Type
Purchase Details
Closed on
Mar 25, 2008
Sold by
Us Bank Na
Bought by
Cummings Larry
Current Estimated Value
Home Financials for this Owner
Home Financials are based on the most recent Mortgage that was taken out on this home.
Original Mortgage
$50,058
Interest Rate
5.87%
Mortgage Type
FHA
Purchase Details
Closed on
Aug 8, 2007
Sold by
Evans Tammy
Bought by
Us Bank Na and Asset Backed Pass Through Certificates S
Purchase Details
Closed on
Jul 18, 2005
Sold by
Gonzales Steven M and Gonzales Trisha A
Bought by
Evans Tammy
Home Financials for this Owner
Home Financials are based on the most recent Mortgage that was taken out on this home.
Original Mortgage
$108,000
Interest Rate
9.65%
Mortgage Type
Purchase Money Mortgage
Purchase Details
Closed on
Jun 30, 1992
Sold by
Stanek Helen E
Bought by
Gonzales Stevenb M
Purchase Details
Closed on
Jan 1, 1975
Bought by
Stanek Helen E
Create a Home Valuation Report for This Property
The Home Valuation Report is an in-depth analysis detailing your home's value as well as a comparison with similar homes in the area
Home Values in the Area
Average Home Value in this Area
Purchase History
| Date | Buyer | Sale Price | Title Company |
|---|---|---|---|
| Cummings Larry | $40,000 | Prism Title & Closing Servic | |
| Us Bank Na | $60,000 | Attorney | |
| Evans Tammy | $120,000 | Heights Title Agency | |
| Gonzales Stevenb M | $60,000 | -- | |
| Stanek Helen E | -- | -- |
Source: Public Records
Mortgage History
| Date | Status | Borrower | Loan Amount |
|---|---|---|---|
| Previous Owner | Cummings Larry | $50,058 | |
| Previous Owner | Evans Tammy | $108,000 |
Source: Public Records
Tax History
| Year | Tax Paid | Tax Assessment Tax Assessment Total Assessment is a certain percentage of the fair market value that is determined by local assessors to be the total taxable value of land and additions on the property. | Land | Improvement |
|---|---|---|---|---|
| 2024 | $2,779 | $41,300 | $7,175 | $34,125 |
| 2023 | $2,201 | $30,670 | $5,150 | $25,520 |
| 2022 | $2,230 | $30,660 | $5,150 | $25,520 |
| 2021 | $2,384 | $30,660 | $5,150 | $25,520 |
| 2020 | $1,794 | $23,210 | $3,890 | $19,320 |
| 2019 | $1,896 | $66,300 | $11,100 | $55,200 |
| 2018 | $2,683 | $23,210 | $3,890 | $19,320 |
| 2017 | $2,749 | $22,120 | $5,040 | $17,080 |
| 2016 | $2,659 | $22,120 | $5,040 | $17,080 |
| 2015 | $2,680 | $22,120 | $5,040 | $17,080 |
| 2014 | $2,680 | $24,290 | $5,530 | $18,760 |
Source: Public Records
Map
Nearby Homes
- 5212 Catherine St
- 16907 Maple Heights Blvd
- 17005 Mapleboro Ave
- 5246 Philip Ave
- 17409 Mapleboro Ave
- 5231 Philip Ave
- 5204 Anthony St
- 17914 Libby Rd
- 17916 North Blvd
- 5481 Dalewood Ave
- 5210 Theodore St
- 5493 Thomas St
- 5239 Arch St
- 5177 Cato St
- 5382 Lee Rd Unit 102
- 5382 Lee Rd Unit 204
- 5382 Lee Rd Unit 202
- 5578 Dalewood Ave
- 5370 Lee Rd Unit 302
- 5150 Arch St
- 5336 Clement Ave
- 5328 Clement Ave
- 5340 Clement Ave
- 5324 Clement Ave
- 5344 Clement Ave
- 5348 Clement Ave
- 5331 Clement Ave
- 5327 Clement Ave
- 5335 Clement Ave
- 5323 Clement Ave
- 5352 Clement Ave
- 5343 Clement Ave
- 5319 Clement Ave
- 5339 Clement Ave
- 17020 Libby Rd
- 17016 Libby Rd
- 17008 Libby Rd
- 5347 Clement Ave
- 17200 Libby Rd
- 17000 Libby Rd
Your Personal Tour Guide
Ask me questions while you tour the home.