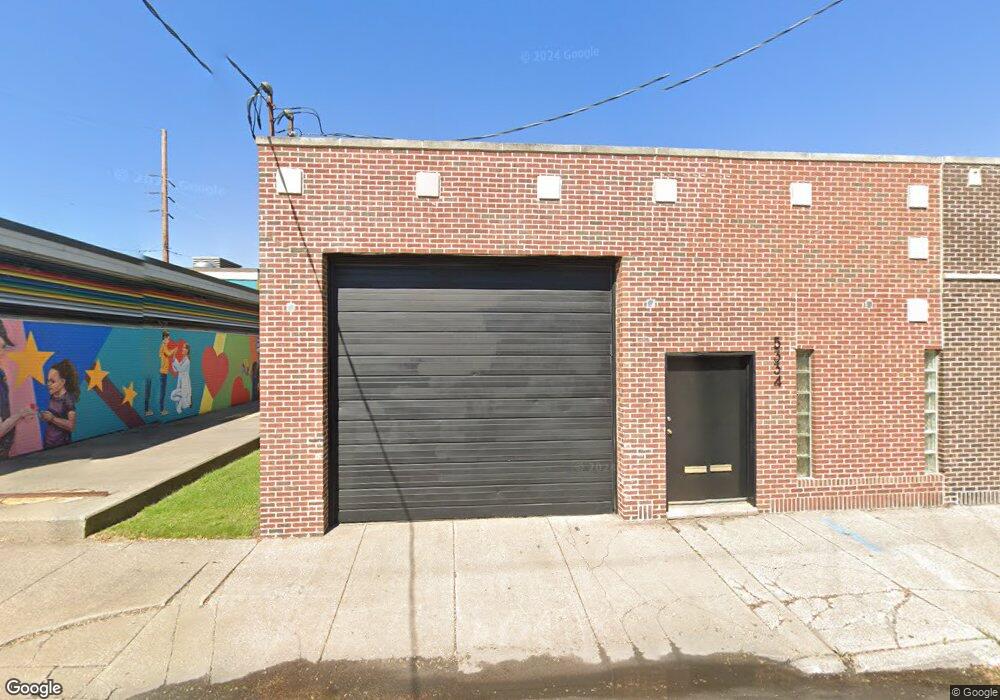
5334 Sohl Ave Hammond, IN 46320
Estimated Value: $67,776
3
Beds
1
Bath
4,033
Sq Ft
$17/Sq Ft
Est. Value
About This Home
This home is located at 5334 Sohl Ave, Hammond, IN 46320 and is currently priced at $67,776, approximately $16 per square foot. 5334 Sohl Ave is a home located in Lake County with nearby schools including Eggers Middle School, Hammond High School, and Hammond Academy Of Science & Tech.
Ownership History
Date
Name
Owned For
Owner Type
Purchase Details
Closed on
Jun 2, 2021
Sold by
Miskic Simon and Miskic Simun
Bought by
Garcia Rafael
Current Estimated Value
Home Financials for this Owner
Home Financials are based on the most recent Mortgage that was taken out on this home.
Original Mortgage
$46,099
Outstanding Balance
$38,404
Interest Rate
2.9%
Mortgage Type
Commercial
Purchase Details
Closed on
May 27, 2021
Sold by
Miskic Simon and Miskic Snezana
Bought by
Grcia Rafael
Home Financials for this Owner
Home Financials are based on the most recent Mortgage that was taken out on this home.
Original Mortgage
$46,099
Outstanding Balance
$38,404
Interest Rate
2.9%
Mortgage Type
Commercial
Create a Home Valuation Report for This Property
The Home Valuation Report is an in-depth analysis detailing your home's value as well as a comparison with similar homes in the area
Home Values in the Area
Average Home Value in this Area
Purchase History
| Date | Buyer | Sale Price | Title Company |
|---|---|---|---|
| Garcia Rafael | -- | Northwest Indiana Title | |
| Grcia Rafael | $40,000 | Northwest Indiana Title |
Source: Public Records
Mortgage History
| Date | Status | Borrower | Loan Amount |
|---|---|---|---|
| Open | Garcia Rafael | $46,099 | |
| Closed | Grcia Rafael | $46,099 |
Source: Public Records
Tax History Compared to Growth
Tax History
| Year | Tax Paid | Tax Assessment Tax Assessment Total Assessment is a certain percentage of the fair market value that is determined by local assessors to be the total taxable value of land and additions on the property. | Land | Improvement |
|---|---|---|---|---|
| 2024 | $4,225 | $90,300 | $19,500 | $70,800 |
| 2023 | $3,216 | $88,400 | $19,500 | $68,900 |
| 2022 | $3,216 | $87,400 | $18,700 | $68,700 |
| 2021 | $3,024 | $81,500 | $18,700 | $62,800 |
| 2020 | $3,040 | $81,500 | $18,700 | $62,800 |
| 2019 | $4,157 | $81,700 | $18,700 | $63,000 |
| 2018 | $3,626 | $78,900 | $18,700 | $60,200 |
| 2017 | $4,369 | $87,400 | $18,700 | $68,700 |
| 2016 | $3,824 | $84,500 | $18,700 | $65,800 |
| 2014 | $4,761 | $126,800 | $14,400 | $112,400 |
| 2013 | $4,430 | $122,900 | $14,400 | $108,500 |
Source: Public Records
Map
Nearby Homes