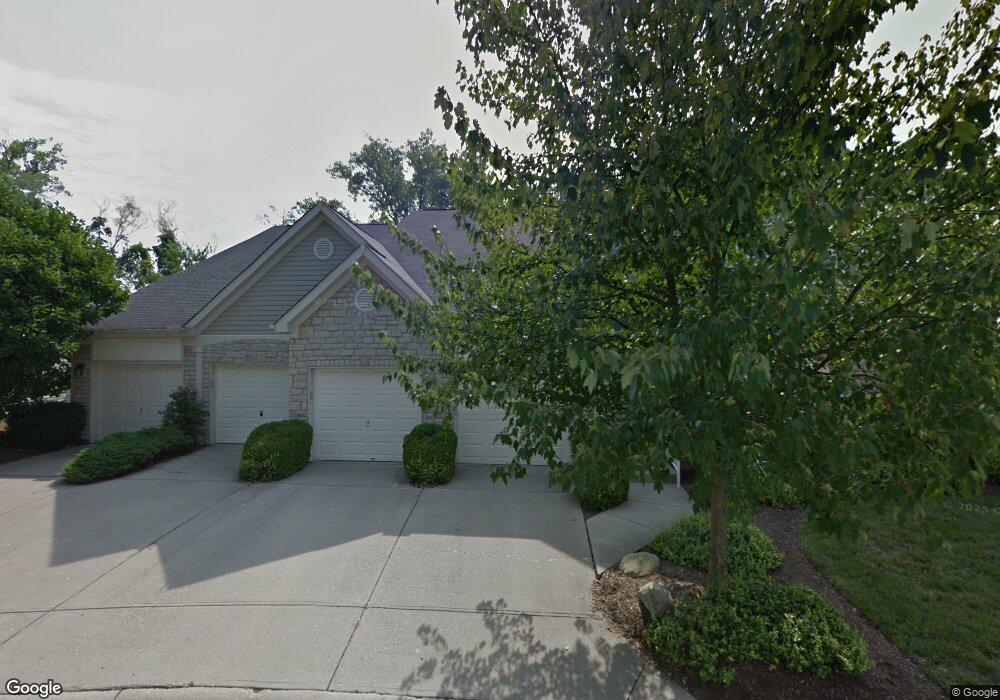
5335 Cooper Rd Cincinnati, OH 45242
Estimated Value: $292,000 - $342,000
3
Beds
2
Baths
1,567
Sq Ft
$198/Sq Ft
Est. Value
About This Home
This home is located at 5335 Cooper Rd, Cincinnati, OH 45242 and is currently estimated at $309,801, approximately $197 per square foot. 5335 Cooper Rd is a home located in Hamilton County with nearby schools including Edwin H Greene Intermediate Middle School, Sycamore Junior High School, and Sycamore High School.
Ownership History
Date
Name
Owned For
Owner Type
Purchase Details
Closed on
Apr 24, 2019
Sold by
Schwartz Kimberly M and Behrends Kimberly
Bought by
Raad Sami
Current Estimated Value
Home Financials for this Owner
Home Financials are based on the most recent Mortgage that was taken out on this home.
Original Mortgage
$138,675
Outstanding Balance
$121,169
Interest Rate
4.3%
Mortgage Type
New Conventional
Estimated Equity
$188,632
Purchase Details
Closed on
Oct 15, 2013
Sold by
Cowan Lilly
Bought by
Schwartz Kimberly M
Home Financials for this Owner
Home Financials are based on the most recent Mortgage that was taken out on this home.
Original Mortgage
$116,314
Interest Rate
4.5%
Mortgage Type
New Conventional
Purchase Details
Closed on
Feb 16, 2009
Sold by
Blicblum Sara
Bought by
Blicblum Sara and The Sara Blicblum Trust
Purchase Details
Closed on
Aug 28, 1995
Sold by
Drees Company
Bought by
Blicblum Simon and Blicblum Sara
Create a Home Valuation Report for This Property
The Home Valuation Report is an in-depth analysis detailing your home's value as well as a comparison with similar homes in the area
Home Values in the Area
Average Home Value in this Area
Purchase History
| Date | Buyer | Sale Price | Title Company |
|---|---|---|---|
| Raad Sami | $184,900 | None Available | |
| Raad Sami | $184,900 | None Available | |
| Schwartz Kimberly M | $120,000 | Attorney | |
| Schwartz Kimberly M | $120,000 | Attorney | |
| Blicblum Sara | -- | Attorney | |
| Blicblum Sara | -- | Attorney | |
| Blicblum Simon | -- | -- | |
| Blicblum Simon | -- | -- |
Source: Public Records
Mortgage History
| Date | Status | Borrower | Loan Amount |
|---|---|---|---|
| Open | Raad Sami | $138,675 | |
| Previous Owner | Schwartz Kimberly M | $116,314 |
Source: Public Records
Tax History
| Year | Tax Paid | Tax Assessment Tax Assessment Total Assessment is a certain percentage of the fair market value that is determined by local assessors to be the total taxable value of land and additions on the property. | Land | Improvement |
|---|---|---|---|---|
| 2025 | $5,241 | $102,445 | $8,750 | $93,695 |
| 2024 | $5,120 | $102,445 | $8,750 | $93,695 |
| 2023 | $5,149 | $102,445 | $8,750 | $93,695 |
| 2022 | $3,900 | $64,715 | $8,750 | $55,965 |
| 2021 | $3,824 | $64,715 | $8,750 | $55,965 |
| 2020 | $3,857 | $64,715 | $8,750 | $55,965 |
| 2019 | $3,323 | $51,384 | $7,000 | $44,384 |
| 2018 | $3,204 | $51,384 | $7,000 | $44,384 |
| 2017 | $2,726 | $51,384 | $7,000 | $44,384 |
| 2016 | $2,310 | $42,000 | $8,750 | $33,250 |
| 2015 | $2,061 | $42,000 | $8,750 | $33,250 |
| 2014 | $2,068 | $42,000 | $8,750 | $33,250 |
| 2013 | $2,921 | $54,845 | $8,750 | $46,095 |
Source: Public Records
Map
Nearby Homes
- 9299 Fidelis Dr
- 9485 Wynnecrest Dr
- 9348 Towne Square Ave
- 6250 Cooper Rd
- 9689 Cooper Ln
- 5831 Belleview Ave
- 9736 Cooper Ln
- 4736 Alpine Ave
- 4737 Alpine Ave
- 7294 Timberknoll Dr
- 4648 Belleview Ave
- 4539 Leslie Ave
- 9001 Cherry St
- 7311 Timberknoll Dr
- 9216 Grandview Ave
- 9500 Todd Dr
- 8880 Raiders Run Rd
- 7775 Hartfield Place
- 5368 Autumnwood Dr
- 4557 Elizabeth Place
- 5325 Cooper Rd Unit C
- 5335 Cooper Rd Unit 21
- 5335 Cooper Rd
- 5325 Cooper Rd Unit 2A
- 5325 Cooper Rd
- 5325 Cooper Rd
- 5325 Cooper Rd
- 5335 Cooper Rd
- 5325 Cooper Rd
- 5335 Cooper Rd
- 5325 Cooper Rd
- 5325 Cooper Rd Unit E
- 5335 Cooper Rd Unit G
- 5325 Cooper Rd Unit D
- 5335 Cooper Rd Unit H
- 5335 Cooper Rd Unit K
- 5329 Cooper Rd Unit E
- 5315 Cooper Rd
- 5315 Cooper Rd
- 5305 Cooper Rd Unit 1B
Your Personal Tour Guide
Ask me questions while you tour the home.