S
Landlord's Agent in 2012
Stephen Hale
New West Property Management
(702) 362-8099
2 in this area
13 Total Sales
Estimated Value: $441,936 - $481,000
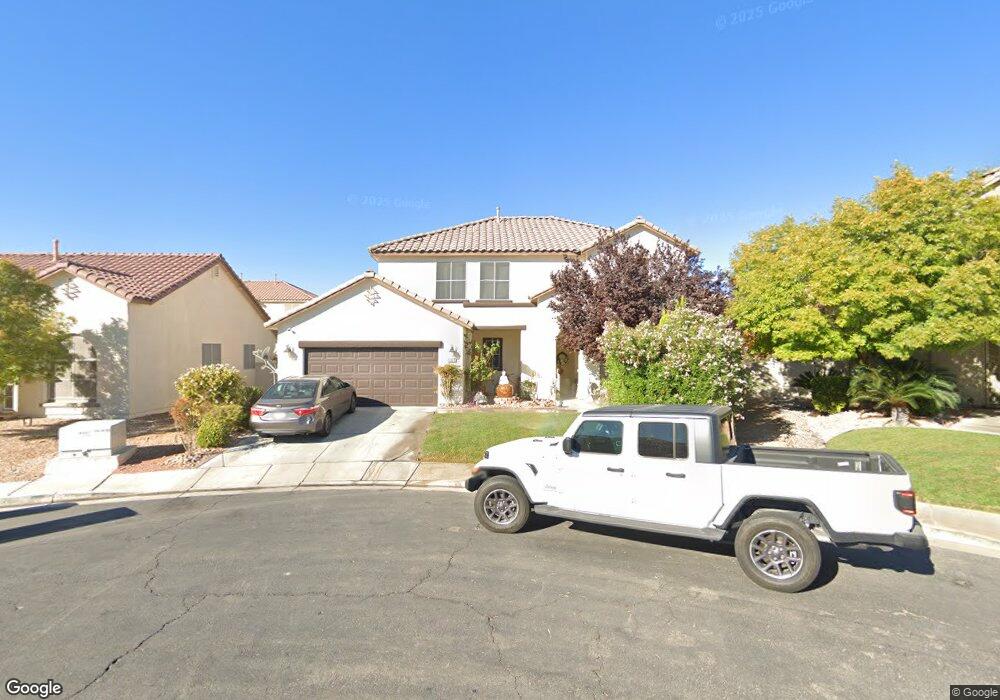
Great 3 Bdrm 2.5 Bath w/ Loft in cul-de-sac. Large kitchen and open floor plan. Master, bedrooms and loft upstairs. Covered patio in backyard with beautiful plants, fruit trees and more! Pets considered case by case.
Last Agent to Rent the Property
New West Property Management License #S.0169703 Listed on: 07/30/2012
Last Renter's Agent
William Leland
Limestone Investments LLC License #BS.0143893
| Date | Buyer | Sale Price | Title Company |
|---|---|---|---|
| Torres Francisco J | $192,000 | Nevada Title Las Vegas | |
| Rich Mark E | $171,645 | First American Title Co |
| Date | Status | Borrower | Loan Amount |
|---|---|---|---|
| Open | Torres Francisco J | $188,522 | |
| Previous Owner | Rich Mark E | $137,300 |
| Date | Event | Price | List to Sale | Price per Sq Ft |
|---|---|---|---|---|
| 12/14/2012 12/14/12 | Rented | $1,000 | -28.3% | -- |
| 11/14/2012 11/14/12 | Under Contract | -- | -- | -- |
| 07/30/2012 07/30/12 | For Rent | $1,395 | -- | -- |
| Year | Tax Paid | Tax Assessment Tax Assessment Total Assessment is a certain percentage of the fair market value that is determined by local assessors to be the total taxable value of land and additions on the property. | Land | Improvement |
|---|---|---|---|---|
| 2025 | $2,355 | $122,123 | $33,600 | $88,523 |
| 2024 | $2,181 | $122,123 | $33,600 | $88,523 |
| 2023 | $2,181 | $116,927 | $33,250 | $83,677 |
| 2022 | $2,020 | $100,483 | $24,150 | $76,333 |
| 2021 | $1,870 | $96,507 | $24,150 | $72,357 |
| 2020 | $1,734 | $95,431 | $23,800 | $71,631 |
| 2019 | $1,625 | $93,540 | $23,100 | $70,440 |
| 2018 | $1,550 | $84,407 | $16,800 | $67,607 |
| 2017 | $1,452 | $69,550 | $16,100 | $53,450 |
| 2016 | $1,452 | $61,531 | $9,800 | $51,731 |
| 2015 | $1,448 | $48,981 | $8,750 | $40,231 |
| 2014 | $1,403 | $40,589 | $7,000 | $33,589 |
S
Landlord's Agent in 2012
Stephen Hale
New West Property Management
(702) 362-8099
2 in this area
13 Total Sales
W
Tenant's Agent in 2012
William Leland
Limestone Investments LLC
Source: Las Vegas REALTORS®
MLS Number: 1271443
APN: 124-33-612-034
Disclaimer: Certain information contained herein is derived from information provided by parties other than Homes.com. All information provided is deemed reliable, but is not guaranteed to be accurate and should be independently verified.
![]() The data relating to real estate for sale on this web site comes in part from the INTERNET DATA EXCHANGE Program of the Greater Las Vegas Association of REALTORS® MLS. Real estate listings held by brokerage firms other than this site owner are marked with the IDX logo. Information is deemed reliable but not guaranteed. Copyright 2025 of the Greater Las Vegas Association of REALTORS® MLS. All rights reserved.
The data relating to real estate for sale on this web site comes in part from the INTERNET DATA EXCHANGE Program of the Greater Las Vegas Association of REALTORS® MLS. Real estate listings held by brokerage firms other than this site owner are marked with the IDX logo. Information is deemed reliable but not guaranteed. Copyright 2025 of the Greater Las Vegas Association of REALTORS® MLS. All rights reserved.
