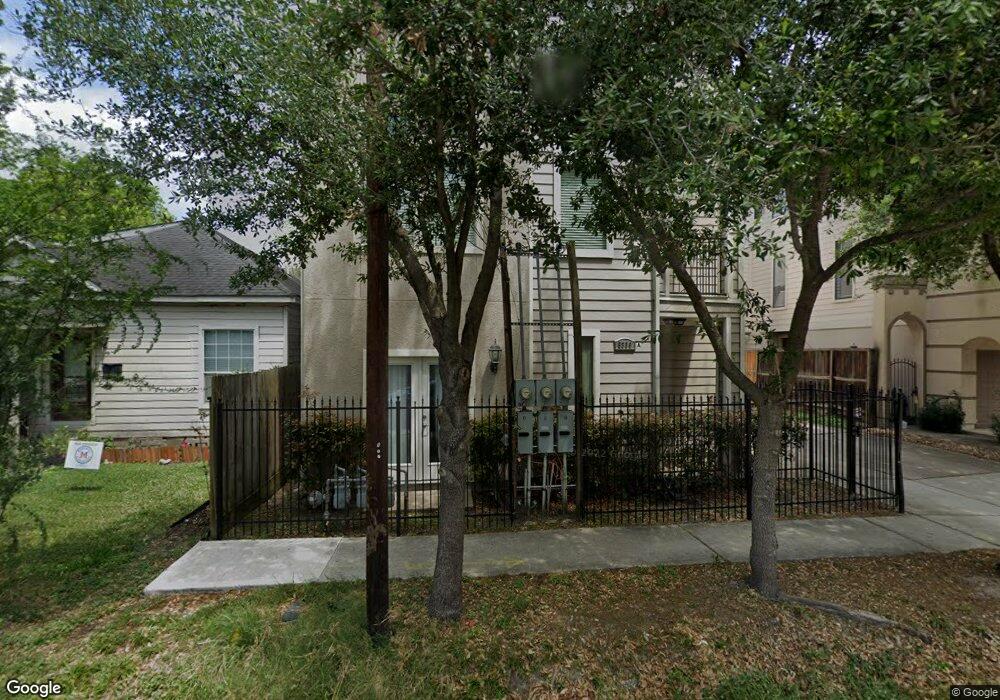
5336 Petty St Unit A Houston, TX 77007
Cottage Grove NeighborhoodEstimated Value: $428,504 - $467,000
3
Beds
4
Baths
2,063
Sq Ft
$216/Sq Ft
Est. Value
About This Home
This home is located at 5336 Petty St Unit A, Houston, TX 77007 and is currently estimated at $446,126, approximately $216 per square foot. 5336 Petty St Unit A is a home located in Harris County with nearby schools including Love Elementary School, Hogg Middle, and Waltrip High School.
Ownership History
Date
Name
Owned For
Owner Type
Purchase Details
Closed on
Jun 1, 2009
Sold by
Cypresswood Residential Home Builders Gr
Bought by
An Hailing
Current Estimated Value
Home Financials for this Owner
Home Financials are based on the most recent Mortgage that was taken out on this home.
Original Mortgage
$202,000
Outstanding Balance
$127,144
Interest Rate
4.7%
Mortgage Type
Purchase Money Mortgage
Estimated Equity
$318,982
Purchase Details
Closed on
Mar 31, 2008
Sold by
5336 Petty Townhomes Ltd
Bought by
Cypresswood Residential Home Builders Gr
Home Financials for this Owner
Home Financials are based on the most recent Mortgage that was taken out on this home.
Original Mortgage
$202,500
Interest Rate
6%
Mortgage Type
Purchase Money Mortgage
Purchase Details
Closed on
Mar 22, 2006
Sold by
Hopwood Ofelia J and Hopwood Ronald L
Bought by
5336 Petty Townhomes Ltd
Create a Home Valuation Report for This Property
The Home Valuation Report is an in-depth analysis detailing your home's value as well as a comparison with similar homes in the area
Home Values in the Area
Average Home Value in this Area
Purchase History
| Date | Buyer | Sale Price | Title Company |
|---|---|---|---|
| An Hailing | -- | Veritas Title | |
| Cypresswood Residential Home Builders Gr | -- | Stewart Title Company | |
| 5336 Petty Townhomes Ltd | -- | Stewart |
Source: Public Records
Mortgage History
| Date | Status | Borrower | Loan Amount |
|---|---|---|---|
| Open | An Hailing | $202,000 | |
| Previous Owner | Cypresswood Residential Home Builders Gr | $202,500 |
Source: Public Records
Tax History Compared to Growth
Tax History
| Year | Tax Paid | Tax Assessment Tax Assessment Total Assessment is a certain percentage of the fair market value that is determined by local assessors to be the total taxable value of land and additions on the property. | Land | Improvement |
|---|---|---|---|---|
| 2025 | $5,867 | $428,325 | $136,500 | $291,825 |
| 2024 | $5,867 | $401,660 | $136,500 | $265,160 |
| 2023 | $5,867 | $410,192 | $117,000 | $293,192 |
| 2022 | $7,841 | $356,092 | $107,250 | $248,842 |
| 2021 | $8,259 | $354,372 | $103,350 | $251,022 |
| 2020 | $8,228 | $339,769 | $97,500 | $242,269 |
| 2019 | $8,795 | $347,587 | $118,950 | $228,637 |
| 2018 | $6,208 | $320,000 | $95,160 | $224,840 |
| 2017 | $8,091 | $320,000 | $95,160 | $224,840 |
| 2016 | $8,091 | $320,000 | $95,160 | $224,840 |
| 2015 | $5,940 | $355,000 | $95,160 | $259,840 |
| 2014 | $5,940 | $335,564 | $83,265 | $252,299 |
Source: Public Records
Map
Nearby Homes
- 5342 Petty St
- 5406 Darling St Unit A
- 2415 Radcliffe St
- 5337 Larkin St
- 5335 Larkin St
- 5226 Kiam St Unit 1002
- 5235a Petty St
- 2519 Radcliffe St
- 5217 Kansas St
- 5308 Larkin St Unit B
- 5429 Larkin St
- 5241 Darling St
- 5228 Darling St Unit B
- 5229 Petty St Unit E
- 5224 Darling St Unit B
- 2115 Detering St
- 5507 Darling St
- 5219 Kiam St Unit F
- 5219 Kiam St Unit E
- 5522 Kiam St Unit A
- 5336 Petty St Unit C
- 5336 Petty St
- 5336 Petty St Unit B
- 5338 Petty St
- 5332 Petty St Unit C
- 5332 Petty St Unit A
- 5332 Petty St Unit B
- 5345 Petty St
- 5347 Petty St
- 5351 Petty St
- 5330 Petty St
- 5339 Kiam St
- 5337 Kiam St
- 5339 Petty St Unit C
- 5339 Petty St Unit C
- 5339 Petty St Unit B
- 5339 Petty St
- 5339 Petty St Unit A
- 5335 Kiam St
- 5323 Kiam St Unit A