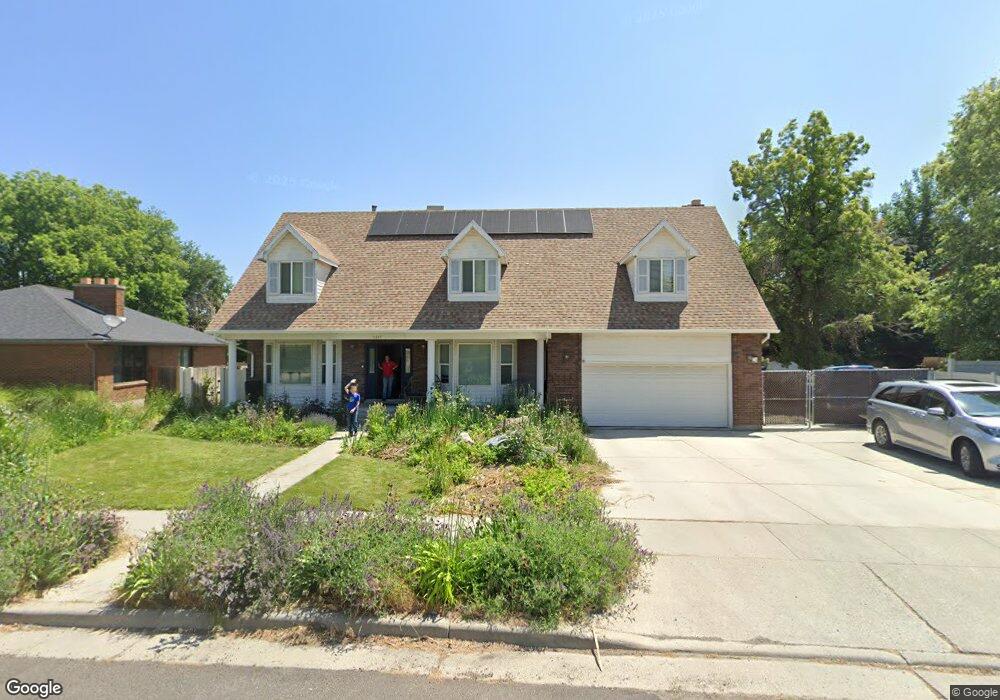
5337 Ferncrest Cir Salt Lake City, UT 84129
Estimated Value: $603,171 - $660,000
6
Beds
4
Baths
2,818
Sq Ft
$226/Sq Ft
Est. Value
About This Home
This home is located at 5337 Ferncrest Cir, Salt Lake City, UT 84129 and is currently estimated at $637,793, approximately $226 per square foot. 5337 Ferncrest Cir is a home located in Salt Lake County with nearby schools including Harry S Truman Elementary School, Eisenhower Jr High School, and Taylorsville High School.
Ownership History
Date
Name
Owned For
Owner Type
Purchase Details
Closed on
Apr 18, 2014
Sold by
Knudsen Robert Edward and Knudsen Susan Lee
Bought by
Knudsen Robert
Current Estimated Value
Home Financials for this Owner
Home Financials are based on the most recent Mortgage that was taken out on this home.
Original Mortgage
$140,000
Outstanding Balance
$106,346
Interest Rate
4.32%
Mortgage Type
New Conventional
Estimated Equity
$531,447
Purchase Details
Closed on
Apr 15, 2013
Sold by
Knudsen Ralph Clark
Bought by
Knudsen Robert Edward and Knudsen Susan Lee
Purchase Details
Closed on
Sep 7, 2006
Sold by
Knudsen Ralph Clark
Bought by
Knudsen Ralph Clark
Purchase Details
Closed on
Nov 17, 1998
Sold by
Hague Donald V and Hague Lorna D
Bought by
Knudsen Ralph C and Knudsen Rene
Purchase Details
Closed on
Feb 23, 1995
Sold by
Hutchings Michael L and Hutchings Terry L
Bought by
Knudsen Ralph C and Knudsen Rene G
Create a Home Valuation Report for This Property
The Home Valuation Report is an in-depth analysis detailing your home's value as well as a comparison with similar homes in the area
Home Values in the Area
Average Home Value in this Area
Purchase History
| Date | Buyer | Sale Price | Title Company |
|---|---|---|---|
| Knudsen Robert | -- | First American Title | |
| Knudsen Robert Edward | -- | Accommodation | |
| Knudsen Ralph Clark | -- | None Available | |
| Knudsen Ralph C | -- | -- | |
| Knudsen Ralph C | -- | -- |
Source: Public Records
Mortgage History
| Date | Status | Borrower | Loan Amount |
|---|---|---|---|
| Open | Knudsen Robert | $140,000 |
Source: Public Records
Tax History Compared to Growth
Tax History
| Year | Tax Paid | Tax Assessment Tax Assessment Total Assessment is a certain percentage of the fair market value that is determined by local assessors to be the total taxable value of land and additions on the property. | Land | Improvement |
|---|---|---|---|---|
| 2025 | $3,506 | $595,200 | $151,000 | $444,200 |
| 2024 | $3,506 | $574,900 | $142,700 | $432,200 |
| 2023 | $3,381 | $543,900 | $137,200 | $406,700 |
| 2022 | $3,481 | $564,800 | $134,600 | $430,200 |
| 2021 | $3,268 | $461,800 | $103,500 | $358,300 |
| 2020 | $3,041 | $406,700 | $103,500 | $303,200 |
| 2019 | $2,978 | $388,900 | $97,600 | $291,300 |
| 2018 | $0 | $360,100 | $97,600 | $262,500 |
| 2017 | $2,800 | $370,600 | $97,600 | $273,000 |
| 2016 | $2,392 | $316,300 | $97,600 | $218,700 |
| 2015 | $2,030 | $250,900 | $91,800 | $159,100 |
| 2014 | $1,955 | $237,300 | $88,900 | $148,400 |
Source: Public Records
Map
Nearby Homes
- 3116 Hayden Way
- 2794 W Harker Ridge Cove
- 5492 S 3200 W
- 4646 Huntington Rd
- 5600 S Ralph Dr
- 5574 Easton St
- 3002 Carranza Dr
- 2658 W Scarsdale Ct Unit 49
- 1891 S Jordan Canal Rd
- 5512 S 3320 W
- 2604 W West Central Park Way
- 5476 S 3350 W
- 2503 5520 S
- 5382 Skeeswood Cir
- 5725 S 2665 W
- 5668 Lolene Way
- 5331 Queenswood Dr
- 2320 W 5400 S
- 3463 W 5585 S
- 4892 S Snarr Haven Ct
- 5325 Ferncrest Cir
- 5349 Ferncrest Cir
- 5349 S Ferncrest Cir
- 5338 S Robinwood Cir
- 5338 Robinwood Cir
- 5324 Robinwood Cir
- 5350 Robinwood Cir
- 5350 S Robinwood Cir
- 5336 Ferncrest Cir
- 5363 Ferncrest Cir
- 5313 Ferncrest Cir
- 5310 Robinwood Cir
- 5310 S Robinwood Cir
- 5348 Ferncrest Cir
- 5324 Ferncrest Cir
- 5324 S Ferncrest Cir
- 5362 S Robinwood Cir
- 5362 Robinwood Cir
- 5362 S Robinwood Cir
- 5362 Ferncrest Cir