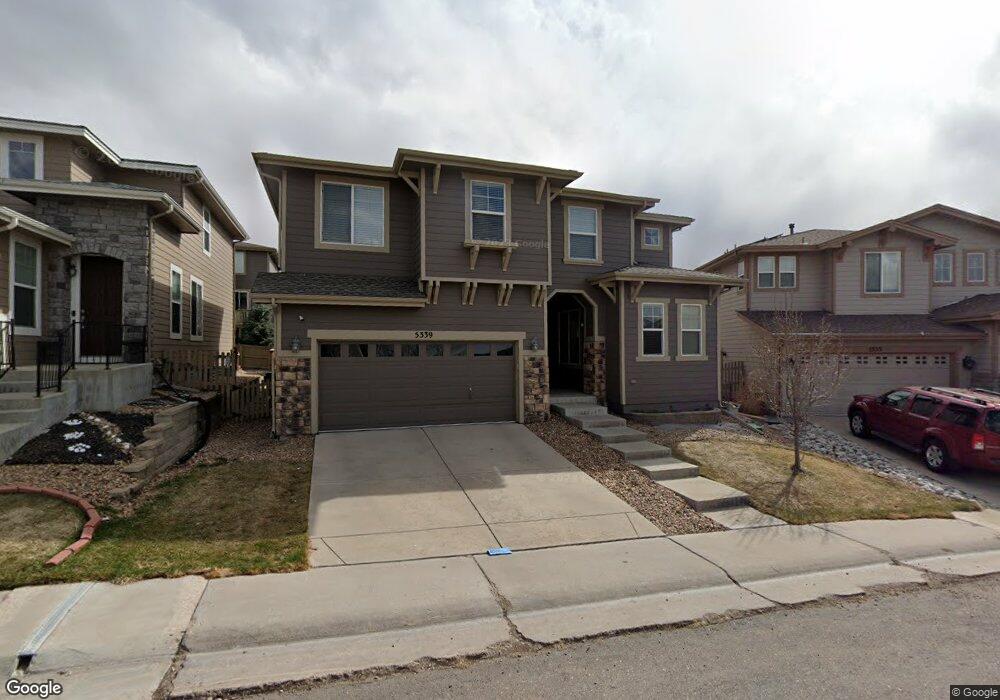
5339 Applebrook Ln Highlands Ranch, CO 80130
Southridge NeighborhoodEstimated Value: $687,219 - $796,000
3
Beds
3
Baths
3,398
Sq Ft
$217/Sq Ft
Est. Value
About This Home
This home is located at 5339 Applebrook Ln, Highlands Ranch, CO 80130 and is currently estimated at $735,805, approximately $216 per square foot. 5339 Applebrook Ln is a home located in Douglas County with nearby schools including Redstone Elementary School, Rocky Heights Middle School, and Rock Canyon High School.
Ownership History
Date
Name
Owned For
Owner Type
Purchase Details
Closed on
Mar 31, 2016
Sold by
Uhm Tae Min
Bought by
Lotiya Priyank J and Shah Swetaben
Current Estimated Value
Home Financials for this Owner
Home Financials are based on the most recent Mortgage that was taken out on this home.
Original Mortgage
$362,400
Outstanding Balance
$287,621
Interest Rate
3.65%
Mortgage Type
New Conventional
Estimated Equity
$448,184
Purchase Details
Closed on
Apr 12, 2007
Sold by
Mullis Andrew D
Bought by
Uhm Tae Min
Home Financials for this Owner
Home Financials are based on the most recent Mortgage that was taken out on this home.
Original Mortgage
$254,400
Interest Rate
6.72%
Mortgage Type
Unknown
Purchase Details
Closed on
Jan 17, 2006
Sold by
Shea Homes Lp
Bought by
Mullis Andrew D
Home Financials for this Owner
Home Financials are based on the most recent Mortgage that was taken out on this home.
Original Mortgage
$253,900
Interest Rate
6.99%
Mortgage Type
Balloon
Create a Home Valuation Report for This Property
The Home Valuation Report is an in-depth analysis detailing your home's value as well as a comparison with similar homes in the area
Home Values in the Area
Average Home Value in this Area
Purchase History
| Date | Buyer | Sale Price | Title Company |
|---|---|---|---|
| Lotiya Priyank J | $453,000 | North American Title | |
| Uhm Tae Min | $318,000 | Fahtco | |
| Mullis Andrew D | $338,563 | None Available |
Source: Public Records
Mortgage History
| Date | Status | Borrower | Loan Amount |
|---|---|---|---|
| Open | Lotiya Priyank J | $362,400 | |
| Previous Owner | Uhm Tae Min | $254,400 | |
| Previous Owner | Mullis Andrew D | $253,900 |
Source: Public Records
Tax History Compared to Growth
Tax History
| Year | Tax Paid | Tax Assessment Tax Assessment Total Assessment is a certain percentage of the fair market value that is determined by local assessors to be the total taxable value of land and additions on the property. | Land | Improvement |
|---|---|---|---|---|
| 2024 | $4,414 | $50,520 | $9,270 | $41,250 |
| 2023 | $4,406 | $50,520 | $9,270 | $41,250 |
| 2022 | $3,349 | $36,660 | $6,370 | $30,290 |
| 2021 | $3,485 | $36,660 | $6,370 | $30,290 |
| 2020 | $3,250 | $35,040 | $6,040 | $29,000 |
| 2019 | $3,262 | $35,040 | $6,040 | $29,000 |
| 2018 | $3,071 | $32,490 | $5,330 | $27,160 |
| 2017 | $2,796 | $32,490 | $5,330 | $27,160 |
| 2016 | $2,682 | $30,590 | $4,600 | $25,990 |
| 2015 | $1,370 | $30,590 | $4,600 | $25,990 |
| 2014 | $2,495 | $25,720 | $4,620 | $21,100 |
Source: Public Records
Map
Nearby Homes
- 10645 Cedarcrest Cir
- 10497 Wagon Box Cir
- 5639 Jaguar Way
- 10660 Jewelberry Cir
- 10754 Towerbridge Cir
- 10445 Cheetah Winds
- 6042 Sima Cir
- 10557 Jaguar Dr
- 10439 Cheetah Winds
- 10557 Eby Cir
- 4965 Huntwick Place
- 5632 Tory Pointe
- 10360 Tracewood Ct
- 10541 Jaguar Glen
- 4656 Ketchwood Cir
- 11036 Glengate Cir
- 10547 Laurelglen Cir
- 10278 Dan Ct
- 4967 Waldenwood Dr
- 5300 Fullerton Ln
- 5347 Applebrook Ln
- 5333 Applebrook Ln
- 5351 Windflower Ln
- 5341 Windflower Ln
- 5361 Windflower Ln
- 5355 Applebrook Ln
- 5327 Applebrook Ln
- 5331 Windflower Ln
- 5373 Windflower Ln
- 5342 Applebrook Ln
- 5352 Applebrook Ln
- 5319 Applebrook Ln
- 5321 Windflower Ln
- 5358 Applebrook Ln
- 5311 Applebrook Ln
- 5350 Windflower Ln
- 5311 Windflower Ln
- 5360 Windflower Ln
- 5340 Windflower Ln
- 5370 Windflower Ln