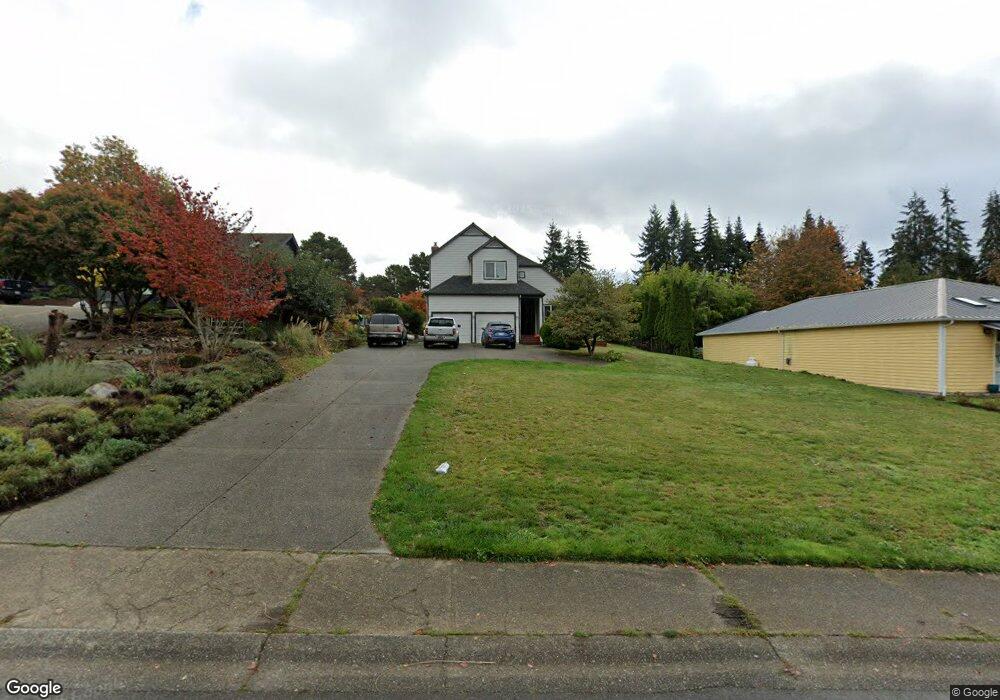
534 Azalea Ave NE Bainbridge Island, WA 98110
Estimated Value: $1,164,000 - $1,492,000
3
Beds
3
Baths
1,847
Sq Ft
$692/Sq Ft
Est. Value
About This Home
This home is located at 534 Azalea Ave NE, Bainbridge Island, WA 98110 and is currently estimated at $1,278,340, approximately $692 per square foot. 534 Azalea Ave NE is a home located in Kitsap County with nearby schools including Bainbridge High School, Madrona School, and St. Cecilia Catholic School.
Ownership History
Date
Name
Owned For
Owner Type
Purchase Details
Closed on
Dec 14, 2020
Sold by
Nemeth Scott J and Nemeth Lauren M
Bought by
Nemeth Scott J and Nemeth Lauren M
Current Estimated Value
Purchase Details
Closed on
Jun 15, 2003
Sold by
Anderson Scott L and Anderson Cynthia L
Bought by
Nemeth Scott J and Walsh Lauren M
Home Financials for this Owner
Home Financials are based on the most recent Mortgage that was taken out on this home.
Original Mortgage
$278,400
Outstanding Balance
$107,645
Interest Rate
4.17%
Mortgage Type
Purchase Money Mortgage
Estimated Equity
$1,170,695
Purchase Details
Closed on
Sep 6, 2000
Sold by
Dougal Robert J and Dougal Patricia A
Bought by
Anderson Scott L and Anderson Cynthia L
Create a Home Valuation Report for This Property
The Home Valuation Report is an in-depth analysis detailing your home's value as well as a comparison with similar homes in the area
Home Values in the Area
Average Home Value in this Area
Purchase History
| Date | Buyer | Sale Price | Title Company |
|---|---|---|---|
| Nemeth Scott J | -- | None Available | |
| Nemeth Scott J | $348,000 | Pacific Nw Title | |
| Anderson Scott L | $328,000 | Pacific Nw Title |
Source: Public Records
Mortgage History
| Date | Status | Borrower | Loan Amount |
|---|---|---|---|
| Open | Nemeth Scott J | $278,400 |
Source: Public Records
Tax History Compared to Growth
Tax History
| Year | Tax Paid | Tax Assessment Tax Assessment Total Assessment is a certain percentage of the fair market value that is determined by local assessors to be the total taxable value of land and additions on the property. | Land | Improvement |
|---|---|---|---|---|
| 2026 | $8,777 | $1,083,090 | $262,770 | $820,320 |
| 2025 | $8,777 | $1,083,090 | $262,770 | $820,320 |
| 2024 | $8,388 | $1,083,090 | $262,770 | $820,320 |
| 2023 | $8,753 | $1,083,100 | $262,780 | $820,320 |
| 2022 | $7,406 | $778,600 | $199,500 | $579,100 |
| 2021 | $6,776 | $678,080 | $173,320 | $504,760 |
| 2020 | $6,449 | $635,560 | $162,100 | $473,460 |
| 2019 | $6,445 | $648,500 | $158,360 | $490,140 |
| 2018 | $6,565 | $513,920 | $124,690 | $389,230 |
| 2017 | $5,395 | $513,920 | $124,690 | $389,230 |
| 2016 | $5,643 | $512,050 | $152,800 | $359,250 |
| 2015 | $4,846 | $447,080 | $133,480 | $313,600 |
| 2014 | -- | $407,380 | $133,480 | $273,900 |
| 2013 | -- | $380,740 | $124,700 | $256,040 |
Source: Public Records
Map
Nearby Homes
- 1237 Hawley Way NE
- 1245 High School Rd NE
- 7268 Madrona Dr NE
- 502 Cave Ave NE
- 744 Hanami Ln NE
- 965 Winslow Way E Unit 104
- 7551 Madrona Dr NE
- 610 NE Vineyard Ln Unit A104
- 752 NE Vineyard Ln Unit L205
- 511 Groos Ln NE
- 1314 Polly's Ln
- 346 Wyatt Way NE Unit 10
- 428 Harborview Dr SE Unit 112
- 465 Winslow Way E Unit 108
- 360 Knechtel Way NE Unit 201
- Three Story Townhome Plan at Wintergreen Townhomes - Winter Green Townhomes
- 1349 Nolta Loop NE
- 1341 Nolta Loop NE
- 1339 Nolta Loop NE
- 300 High School Rd NE Unit 318
- 578 Azalea Ave NE
- 512 Azalea Ave NE
- 11022 Wing Point Way NE
- 610 Azalea Ave NE
- 11020 Wing Point Way NE
- 506 Azalea Ave NE
- 11024 Wing Point Way NE
- 632 Azalea Ave NE
- 11024 Wing Point Way NE
- 637 Azalea Ave NE
- 579 Azalea Ave NE
- 555 Azalea Ave NE
- 677 Azalea Ave NE
- 657 Azalea Ave NE
- 527 Azalea Ave NE
- 707 Azalea Ave NE
- 648 Azalea Ave NE
- 702 Azalea Ave NE
- 727 Azalea Ave NE
- 654 Ferryview Ln NE