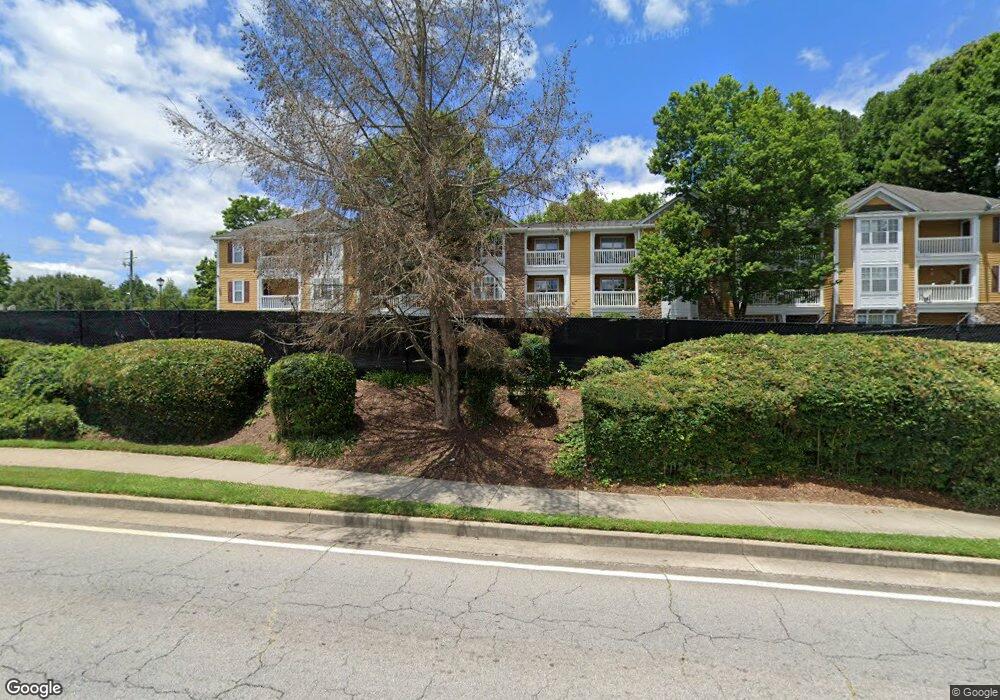
534 Bentley Place Unit 534 Tucker, GA 30084
Pittsburg NeighborhoodEstimated Value: $196,860 - $209,000
2
Beds
2
Baths
1,124
Sq Ft
$180/Sq Ft
Est. Value
About This Home
This home is located at 534 Bentley Place Unit 534, Tucker, GA 30084 and is currently estimated at $202,215, approximately $179 per square foot. 534 Bentley Place Unit 534 is a home located in DeKalb County with nearby schools including Livsey Elementary School, Tucker Middle School, and Tucker High School.
Ownership History
Date
Name
Owned For
Owner Type
Purchase Details
Closed on
Sep 28, 2022
Sold by
Love Kadesha G
Bought by
Love Kadesha G and Love Norma Harry
Current Estimated Value
Home Financials for this Owner
Home Financials are based on the most recent Mortgage that was taken out on this home.
Original Mortgage
$157,500
Outstanding Balance
$150,323
Interest Rate
5.3%
Mortgage Type
New Conventional
Estimated Equity
$51,892
Purchase Details
Closed on
Aug 23, 2022
Sold by
Elner Regina
Bought by
Love Kadesha G
Home Financials for this Owner
Home Financials are based on the most recent Mortgage that was taken out on this home.
Original Mortgage
$157,500
Outstanding Balance
$150,323
Interest Rate
5.3%
Mortgage Type
New Conventional
Estimated Equity
$51,892
Purchase Details
Closed on
Oct 31, 2001
Sold by
Bentley Place Condo Llc
Bought by
Elner Regina
Home Financials for this Owner
Home Financials are based on the most recent Mortgage that was taken out on this home.
Original Mortgage
$108,600
Interest Rate
6.74%
Mortgage Type
New Conventional
Create a Home Valuation Report for This Property
The Home Valuation Report is an in-depth analysis detailing your home's value as well as a comparison with similar homes in the area
Home Values in the Area
Average Home Value in this Area
Purchase History
| Date | Buyer | Sale Price | Title Company |
|---|---|---|---|
| Love Kadesha G | -- | -- | |
| Love Kadesha G | $165,000 | -- | |
| Elner Regina | $112,000 | -- |
Source: Public Records
Mortgage History
| Date | Status | Borrower | Loan Amount |
|---|---|---|---|
| Open | Love Kadesha G | $157,500 | |
| Previous Owner | Elner Regina | $108,600 |
Source: Public Records
Tax History Compared to Growth
Tax History
| Year | Tax Paid | Tax Assessment Tax Assessment Total Assessment is a certain percentage of the fair market value that is determined by local assessors to be the total taxable value of land and additions on the property. | Land | Improvement |
|---|---|---|---|---|
| 2025 | $3,774 | $85,200 | $10,000 | $75,200 |
| 2024 | $3,513 | $79,160 | $10,000 | $69,160 |
| 2023 | $3,513 | $66,000 | $8,800 | $57,200 |
| 2022 | $2,656 | $59,960 | $8,000 | $51,960 |
| 2021 | $2,250 | $50,720 | $8,000 | $42,720 |
| 2020 | $2,024 | $45,560 | $8,000 | $37,560 |
| 2019 | $1,982 | $44,600 | $8,000 | $36,600 |
| 2018 | $1,427 | $35,120 | $4,480 | $30,640 |
| 2017 | $1,481 | $32,240 | $4,480 | $27,760 |
| 2016 | $1,175 | $26,040 | $4,480 | $21,560 |
| 2014 | $979 | $21,080 | $4,480 | $16,600 |
Source: Public Records
Map
Nearby Homes
- 434 Bentley Place
- 533 Bentley Place
- 328 Bentley Place
- 225 Bentley Place
- 3274 Enfield Ct
- 4125 Spring Valley Cir Unit 7
- 3160 Shadow Walk Ln
- 4075 Woodridge Way
- 5011 Woodridge Way
- 5031 Woodridge Way
- 6001 Kingsbridge Rd Unit 3
- 4005 Woodridge Way
- 3987 Woodridge Way
- 3991 Woodridge Way
- 5068 Woodridge Way
- 5081 Woodridge Way
- 3207 Westwood Dr
- 524 Bentley Place
- 514 Bentley Place Unit 514
- 532 Bentley Place
- 522 Bentley Place
- 512 Bentley Place Unit 512
- 513 Bentley Place
- 537 Bentley Place
- 527 Bentley Place
- 517 Bentley Place
- 531 Bentley Place
- 521 Bentley Place
- 511 Bentley Place
- 535 Bentley Place
- 525 Bentley Place Unit 525
- 515 Bentley Place
- 436 Bentley Place Unit 436
- 416 Bentley Place
- 416 Bentley Place Unit 400
- 426 Bentley Place