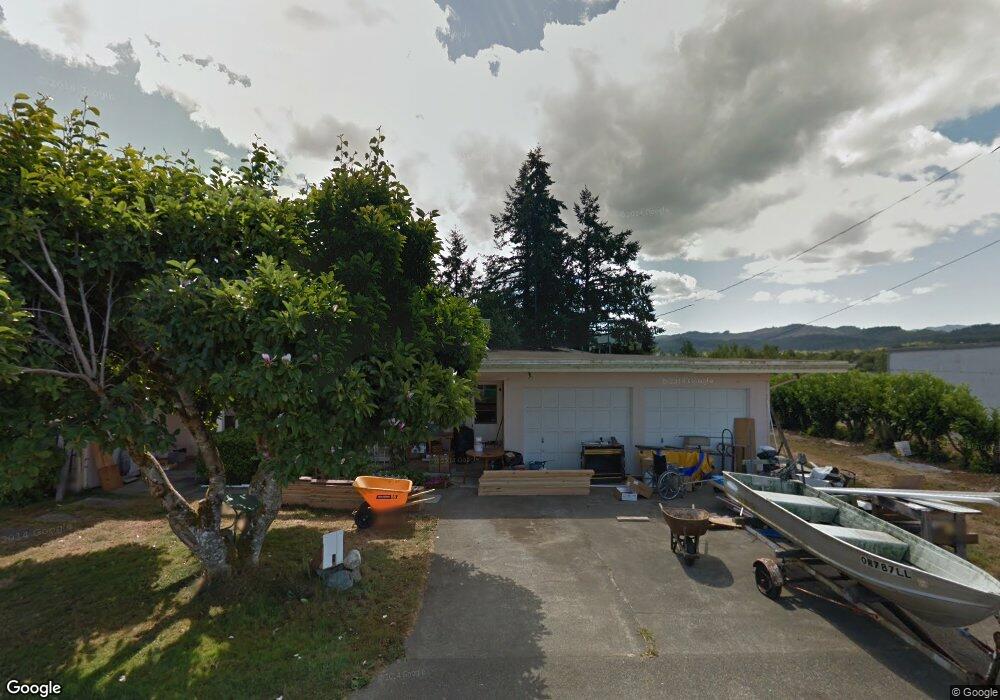
534 Doborout St Myrtle Point, OR 97458
Estimated Value: $365,000 - $368,999
3
Beds
2
Baths
2,478
Sq Ft
$148/Sq Ft
Est. Value
About This Home
This home is located at 534 Doborout St, Myrtle Point, OR 97458 and is currently estimated at $367,000, approximately $148 per square foot. 534 Doborout St is a home located in Coos County with nearby schools including Myrtle Crest School and Myrtle Point High School.
Ownership History
Date
Name
Owned For
Owner Type
Purchase Details
Closed on
Aug 30, 2022
Sold by
Charles Hoskin Sidney
Bought by
Hoskin Charles and Thompson Edith Joanne
Current Estimated Value
Purchase Details
Closed on
Aug 19, 2015
Sold by
Spencer William Charles
Bought by
Spencer William Charles and Hoskin Sidney Charles
Purchase Details
Closed on
Mar 23, 2004
Sold by
Thompson Hilda L and Thompson Harrison E
Bought by
Thompson Hilda L and Spencer William Charles
Create a Home Valuation Report for This Property
The Home Valuation Report is an in-depth analysis detailing your home's value as well as a comparison with similar homes in the area
Home Values in the Area
Average Home Value in this Area
Purchase History
| Date | Buyer | Sale Price | Title Company |
|---|---|---|---|
| Hoskin Charles | -- | -- | |
| Spencer William Charles | -- | None Available | |
| Spencer William Charles | -- | None Available | |
| Thompson Hilda L | -- | -- |
Source: Public Records
Tax History
| Year | Tax Paid | Tax Assessment Tax Assessment Total Assessment is a certain percentage of the fair market value that is determined by local assessors to be the total taxable value of land and additions on the property. | Land | Improvement |
|---|---|---|---|---|
| 2025 | $3,204 | $193,300 | -- | -- |
| 2024 | $3,151 | $187,670 | -- | -- |
| 2023 | $3,006 | $182,210 | $0 | $0 |
| 2022 | $2,959 | $176,910 | $0 | $0 |
| 2021 | $2,883 | $171,760 | $0 | $0 |
| 2020 | $2,803 | $171,760 | $0 | $0 |
| 2019 | $2,681 | $161,910 | $0 | $0 |
| 2018 | $2,607 | $157,200 | $0 | $0 |
| 2017 | $2,539 | $152,630 | $0 | $0 |
| 2016 | $2,460 | $148,190 | $0 | $0 |
| 2015 | $2,257 | $143,880 | $0 | $0 |
| 2014 | $2,257 | $139,690 | $0 | $0 |
Source: Public Records
Map
Nearby Homes
- 805 C St
- 1005 Maple St
- 1404 Harris St
- 618/620 Spruce St
- 227 Border St
- 1211 Fairview St
- 536 18th St
- 0 Roseburg Rd Unit 601
- 1783 View St
- 1829 E Willow St
- 54124 Old Broadbent Rd
- 0 Sitkum Ln Unit 300
- 1985 Roseburg Rd
- 1715 20th St
- 1753 20th St
- 2031 Kincheloe Ln
- 0 Pleasant Valley Rd Unit 22531177
- 94263 Matheny Creek Ln
- 94104 Pleasant Valley Ln
- 93521 Pleasant Valley Ln
Your Personal Tour Guide
Ask me questions while you tour the home.