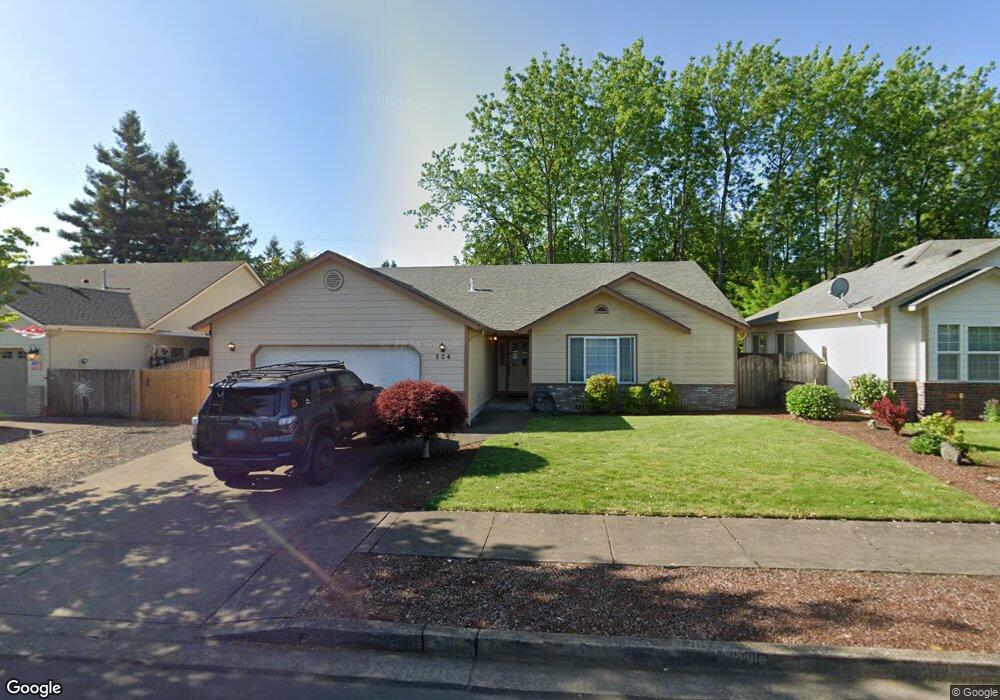
534 E Anchor Ave Eugene, OR 97404
Santa Clara NeighborhoodEstimated Value: $458,000 - $510,000
3
Beds
2
Baths
1,641
Sq Ft
$292/Sq Ft
Est. Value
About This Home
This home is located at 534 E Anchor Ave, Eugene, OR 97404 and is currently estimated at $478,903, approximately $291 per square foot. 534 E Anchor Ave is a home located in Lane County with nearby schools including Spring Creek Elementary School, Madison Middle School, and North Eugene High School.
Ownership History
Date
Name
Owned For
Owner Type
Purchase Details
Closed on
Dec 9, 2025
Sold by
Beverly A Kempf Revocable Living Trust and Boyce Nancy A
Bought by
Darlene L Goss Living Trust and Goss
Current Estimated Value
Purchase Details
Closed on
Sep 5, 2013
Sold by
Anchor Avenue Llc
Bought by
Kempf Beverly A and Beverly A Kempf Revocable Living Trust
Purchase Details
Closed on
Dec 27, 2012
Sold by
Kempf Beverly A
Bought by
Anchor Avenue Llc
Purchase Details
Closed on
Feb 3, 2011
Sold by
Gathright Robyn L
Bought by
Kempf Beverly A
Purchase Details
Closed on
Aug 23, 2001
Sold by
Hendrick David and Hendrick Sue
Bought by
Gathright Robyn L
Home Financials for this Owner
Home Financials are based on the most recent Mortgage that was taken out on this home.
Original Mortgage
$136,500
Interest Rate
7.47%
Purchase Details
Closed on
Mar 30, 1998
Sold by
River Bend Homes Inc
Bought by
Hendrick David and Hendrick Sue
Home Financials for this Owner
Home Financials are based on the most recent Mortgage that was taken out on this home.
Original Mortgage
$106,500
Interest Rate
7%
Create a Home Valuation Report for This Property
The Home Valuation Report is an in-depth analysis detailing your home's value as well as a comparison with similar homes in the area
Home Values in the Area
Average Home Value in this Area
Purchase History
| Date | Buyer | Sale Price | Title Company |
|---|---|---|---|
| Darlene L Goss Living Trust | -- | Cascade Title | |
| Kempf Beverly A | -- | None Available | |
| Anchor Avenue Llc | -- | None Available | |
| Kempf Beverly A | $218,000 | First American Title | |
| Gathright Robyn L | $151,900 | Western Pioneer Title Co | |
| Hendrick David | $148,000 | Key Title Company |
Source: Public Records
Mortgage History
| Date | Status | Borrower | Loan Amount |
|---|---|---|---|
| Previous Owner | Gathright Robyn L | $136,500 | |
| Previous Owner | Hendrick David | $106,500 |
Source: Public Records
Tax History
| Year | Tax Paid | Tax Assessment Tax Assessment Total Assessment is a certain percentage of the fair market value that is determined by local assessors to be the total taxable value of land and additions on the property. | Land | Improvement |
|---|---|---|---|---|
| 2025 | $5,461 | $280,305 | -- | -- |
| 2024 | $5,393 | $272,141 | -- | -- |
| 2023 | $5,393 | $264,215 | $0 | $0 |
| 2022 | $5,053 | $256,520 | $0 | $0 |
| 2021 | $4,715 | $249,049 | $0 | $0 |
| 2020 | $4,580 | $241,796 | $0 | $0 |
| 2019 | $4,392 | $234,754 | $0 | $0 |
| 2018 | $4,118 | $221,279 | $0 | $0 |
| 2017 | $3,830 | $221,279 | $0 | $0 |
| 2016 | $3,641 | $214,834 | $0 | $0 |
| 2015 | $3,536 | $208,577 | $0 | $0 |
| 2014 | $3,476 | $202,502 | $0 | $0 |
Source: Public Records
Map
Nearby Homes
- 504 Dean Ave
- 556 Cinderella Loop
- 3352 Zane Ln
- 3346 Zane Ln
- 3910 Andover St
- 51 Grizzly Ave
- 190 River Loop 1
- 329 Dean Ave
- 355 River Loop 2
- 514 Warrington Ave
- 374 Blackfoot Ave
- 190 Hunsaker Ln
- 0 450-1 Unit 582743661
- 450 Hunsaker Ln
- 0 450-2 Unit 657824339
- 528 Nottingham Ave
- 2640 Green Villa Ln
- 3256 Marvin Dr
- 425 Autumn Ave
- 3698 Revell St
- 514 E Anchor Ave
- 548 E Anchor Ave
- 502 E Anchor Ave
- 531 E Anchor Ave
- 3532 Kendra St
- 490 E Anchor Ave
- 505 E Anchor Ave
- 3513 Kendra St
- 3451 Kendra St
- 3529 Kendra St
- 3548 Kendra St
- 509 E Anchor Ave
- 3552 Kendra St
- 3543 Kendra St
- 482 E Anchor Ave
- 626 Terra Linda Ave
- 481 E Anchor Ave
- 647 Terra Linda Ave
- 517 E Anchor Ave
- 3557 Kendra St
Your Personal Tour Guide
Ask me questions while you tour the home.