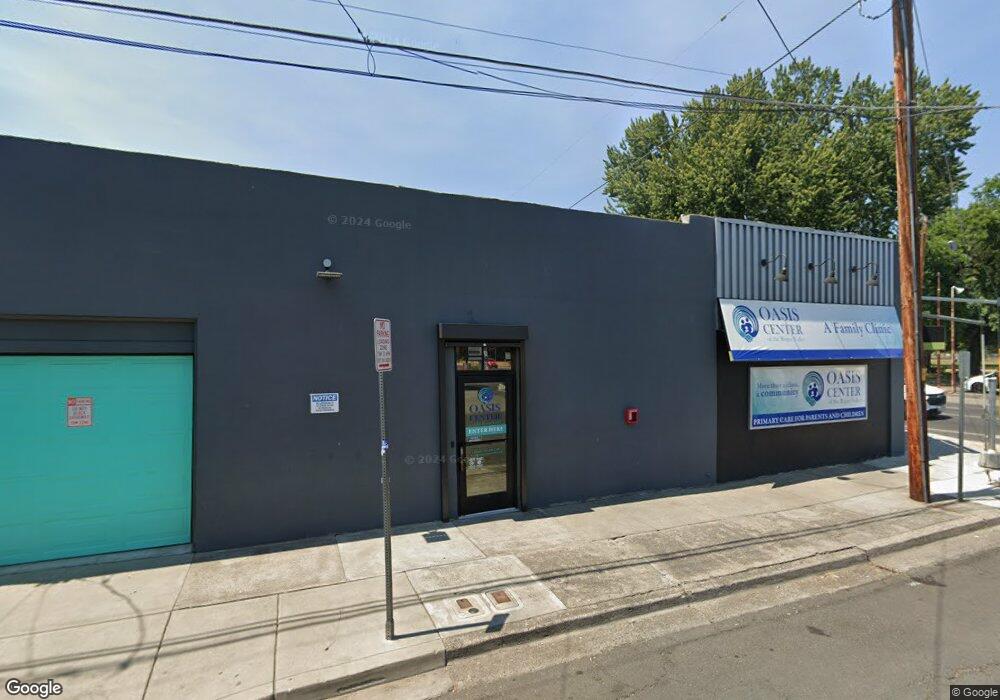
534 E Main St Medford, OR 97504
Estimated Value: $418,658
--
Bed
--
Bath
5,576
Sq Ft
$75/Sq Ft
Est. Value
About This Home
This home is located at 534 E Main St, Medford, OR 97504 and is currently estimated at $418,658, approximately $75 per square foot. 534 E Main St is a home located in Jackson County with nearby schools including Roosevelt Elementary School, Hedrick Middle School, and South Medford High School.
Ownership History
Date
Name
Owned For
Owner Type
Purchase Details
Closed on
Oct 31, 2022
Sold by
Imperium Exchange Llc
Bought by
Oasis Center Of The Rogue Valley
Current Estimated Value
Home Financials for this Owner
Home Financials are based on the most recent Mortgage that was taken out on this home.
Original Mortgage
$300,000
Interest Rate
6.92%
Mortgage Type
Construction
Purchase Details
Closed on
Mar 8, 2016
Sold by
Barr Dennis L and Barr Judith A
Bought by
Imperium Llc
Home Financials for this Owner
Home Financials are based on the most recent Mortgage that was taken out on this home.
Original Mortgage
$207,000
Interest Rate
3.71%
Mortgage Type
Seller Take Back
Purchase Details
Closed on
Jul 20, 1999
Sold by
Barr Dennis L and Barr Judith A
Bought by
Barr Dennis L and Barr Judith A
Purchase Details
Closed on
Jul 2, 1993
Sold by
Gordenier Jo Ann C
Bought by
Barr Dennis L and Barr Judith A
Create a Home Valuation Report for This Property
The Home Valuation Report is an in-depth analysis detailing your home's value as well as a comparison with similar homes in the area
Home Values in the Area
Average Home Value in this Area
Purchase History
| Date | Buyer | Sale Price | Title Company |
|---|---|---|---|
| Oasis Center Of The Rogue Valley | -- | Ticor Title | |
| Imperium Llc | $246,750 | First American | |
| Barr Dennis L | -- | None Available | |
| Barr Dennis L | $120,000 | Lawyers Title Insurance Corp |
Source: Public Records
Mortgage History
| Date | Status | Borrower | Loan Amount |
|---|---|---|---|
| Closed | Oasis Center Of The Rogue Valley | $300,000 | |
| Previous Owner | Imperium Llc | $207,000 |
Source: Public Records
Tax History Compared to Growth
Tax History
| Year | Tax Paid | Tax Assessment Tax Assessment Total Assessment is a certain percentage of the fair market value that is determined by local assessors to be the total taxable value of land and additions on the property. | Land | Improvement |
|---|---|---|---|---|
| 2025 | -- | -- | -- | -- |
| 2024 | -- | -- | -- | -- |
| 2023 | $0 | -- | -- | -- |
| 2022 | $0 | $0 | $0 | $0 |
| 2021 | $3,125 | $214,030 | $67,440 | $146,590 |
| 2020 | $3,005 | $201,750 | $63,570 | $138,180 |
| 2019 | $3,061 | $201,750 | $63,570 | $138,180 |
| 2018 | $3,067 | $186,810 | $58,860 | $127,950 |
| 2017 | $2,850 | $186,810 | $58,860 | $127,950 |
| 2016 | $3,022 | $189,200 | $59,610 | $129,590 |
| 2015 | $3,102 | $183,220 | $57,730 | $125,490 |
| 2014 | $3,047 | $189,610 | $48,140 | $141,470 |
Source: Public Records
Map
Nearby Homes
- 619 E Main St
- 31 Geneva St
- 109 Geneva St
- 818 Sherman St
- 23 - 27 Crater Lake Ave
- 23 Crater Lake Ave
- 214 Stark St
- 2749 Pronghorn Ln
- 719 Bennett Ave
- 858 E 9th St
- 1008 Queen Anne Ave
- 1016 Queen Anne Ave
- 1104 Reddy Ave
- 122 Willamette Ave
- 313 Marie St
- 120 Ashland Ave
- 824 N Riverside Ave
- 440 N Grape St
- 243 N Holly St
- 427 N Grape St