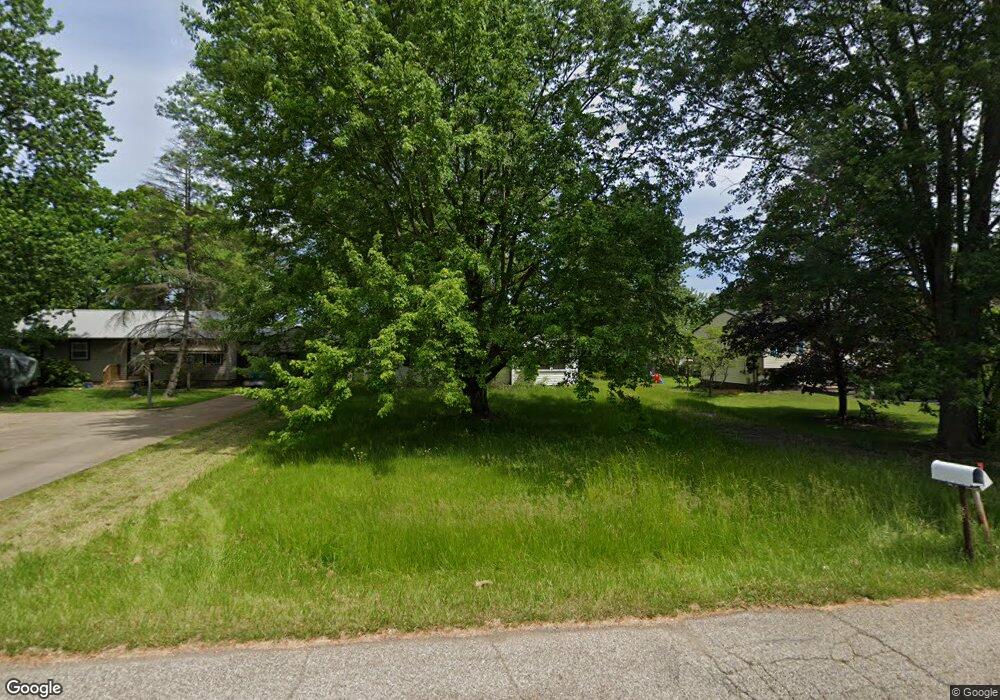
534 Eldon Dr NW Warren, OH 44483
Estimated Value: $129,000 - $183,000
3
Beds
1
Bath
984
Sq Ft
$147/Sq Ft
Est. Value
About This Home
This home is located at 534 Eldon Dr NW, Warren, OH 44483 and is currently estimated at $144,546, approximately $146 per square foot. 534 Eldon Dr NW is a home located in Trumbull County with nearby schools including Champion Central Elementary School, Champion Middle School, and Champion High School.
Ownership History
Date
Name
Owned For
Owner Type
Purchase Details
Closed on
Jun 27, 2024
Sold by
Pekarovic Land Company Llc
Bought by
Pruitt Timothy L
Current Estimated Value
Home Financials for this Owner
Home Financials are based on the most recent Mortgage that was taken out on this home.
Original Mortgage
$143,200
Outstanding Balance
$141,473
Interest Rate
6.94%
Mortgage Type
New Conventional
Estimated Equity
$3,073
Purchase Details
Closed on
Mar 28, 2024
Sold by
Sheriff Of Trumbull County
Bought by
Pekarovic Land Company Llc
Purchase Details
Closed on
May 11, 1999
Sold by
Swanson Shawn
Bought by
Krokoski Carolyn M
Purchase Details
Closed on
Apr 7, 1997
Sold by
Bollinger Stanley W
Bought by
Swanson Shawn
Home Financials for this Owner
Home Financials are based on the most recent Mortgage that was taken out on this home.
Original Mortgage
$59,969
Interest Rate
7.65%
Mortgage Type
FHA
Purchase Details
Closed on
Jan 1, 1990
Bought by
Stanley
Create a Home Valuation Report for This Property
The Home Valuation Report is an in-depth analysis detailing your home's value as well as a comparison with similar homes in the area
Home Values in the Area
Average Home Value in this Area
Purchase History
| Date | Buyer | Sale Price | Title Company |
|---|---|---|---|
| Pruitt Timothy L | $179,000 | None Listed On Document | |
| Pekarovic Land Company Llc | $66,000 | None Listed On Document | |
| Krokoski Carolyn M | $60,793 | -- | |
| Swanson Shawn | $60,000 | -- | |
| Stanley | -- | -- |
Source: Public Records
Mortgage History
| Date | Status | Borrower | Loan Amount |
|---|---|---|---|
| Open | Pruitt Timothy L | $143,200 | |
| Previous Owner | Swanson Shawn | $59,969 | |
| Closed | Krokoski Carolyn M | -- |
Source: Public Records
Tax History
| Year | Tax Paid | Tax Assessment Tax Assessment Total Assessment is a certain percentage of the fair market value that is determined by local assessors to be the total taxable value of land and additions on the property. | Land | Improvement |
|---|---|---|---|---|
| 2024 | $1,664 | $31,010 | $6,720 | $24,290 |
| 2023 | $1,604 | $31,010 | $6,720 | $24,290 |
| 2022 | $1,547 | $24,360 | $5,670 | $18,690 |
| 2021 | $1,539 | $24,360 | $5,670 | $18,690 |
| 2020 | $1,733 | $24,360 | $5,670 | $18,690 |
| 2019 | $854 | $22,230 | $5,670 | $16,560 |
| 2018 | $863 | $22,230 | $5,670 | $16,560 |
| 2017 | $1,391 | $22,230 | $5,670 | $16,560 |
| 2016 | $1,479 | $22,860 | $5,670 | $17,190 |
| 2015 | $1,424 | $22,860 | $5,670 | $17,190 |
| 2014 | $1,310 | $22,860 | $5,670 | $17,190 |
| 2013 | $1,343 | $23,940 | $5,670 | $18,270 |
Source: Public Records
Map
Nearby Homes
- 2173 Clearview Dr
- 4950 Myrtle Ave NW
- 5208 Copeland Ave NW
- 5177 Mahoning Ave NW
- 4841 Damon Ave NW
- 5216 Kuszmaul Ave NW
- 5212 Calla Ave NW
- 5143 Calla Ave NW
- 4850 Lynn Place NW
- 5298 Calla Ave NW
- 0 Old Colony Rd NW Unit 5181512
- 4481 Nutwood Ave NW
- 5554 Alva Ave NW
- 4484 Nutwood Ave NW
- 202 Cleveland Ave E
- 140 Fairway Place NW Unit X140
- 594 Center St W
- 5 Nezbar Dr NW
- 4 Nezbar Dr NW
- 6 Nezbar Dr NW
- 520 Eldon Dr NW
- 548 Eldon Dr NW
- 562 Eldon Dr NW
- 506 Eldon Dr NW
- 2309 Clearview Ave NW
- 2301 Clearview Ave NW
- 2316 Clearview Ave NW
- 576 Eldon Dr NW
- 541 Eldon Dr NW
- 527 Eldon Dr NW
- 2295 Clearview Ave NW
- 2322 Clearview Ave NW
- 555 Eldon Dr NW
- 482 Eldon Dr NW
- 590 Eldon Dr NW
- 569 Eldon Dr NW
- 2329 Clearview Ave NW
- 499 Eldon Dr NW
- 583 Eldon Dr NW
- 2285 Clearview Ave NW
Your Personal Tour Guide
Ask me questions while you tour the home.