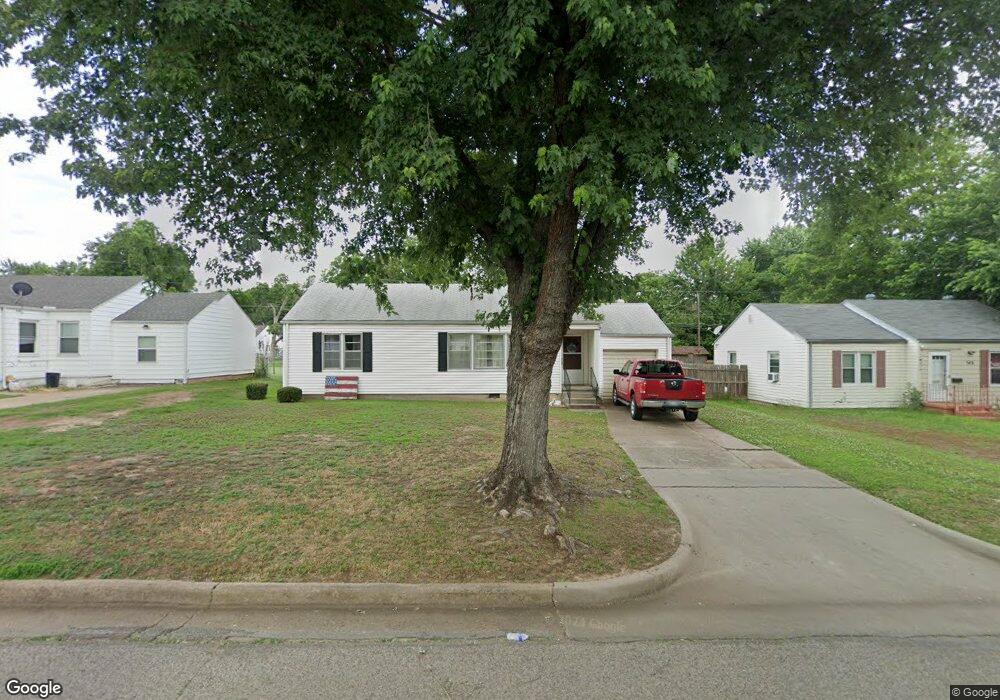
534 N 11th St Ponca City, OK 74601
Estimated Value: $78,000 - $89,000
2
Beds
1
Bath
940
Sq Ft
$90/Sq Ft
Est. Value
About This Home
This home is located at 534 N 11th St, Ponca City, OK 74601 and is currently estimated at $84,693, approximately $90 per square foot. 534 N 11th St is a home located in Kay County with nearby schools including Roosevelt Elementary School, Ponca City East Middle School, and Ponca City West Middle School.
Ownership History
Date
Name
Owned For
Owner Type
Purchase Details
Closed on
Oct 14, 2015
Sold by
Allen Daniel R and Allen Sarah E
Bought by
Walker Michael S and Walker Rhonda L
Current Estimated Value
Home Financials for this Owner
Home Financials are based on the most recent Mortgage that was taken out on this home.
Original Mortgage
$48,486
Interest Rate
3.93%
Mortgage Type
Commercial
Purchase Details
Closed on
Aug 3, 2012
Sold by
Hansen Jeffery L and Hansen Gregory E
Bought by
Allen Daniel R and Walker Sarah E
Home Financials for this Owner
Home Financials are based on the most recent Mortgage that was taken out on this home.
Original Mortgage
$35,500
Interest Rate
3.68%
Mortgage Type
Future Advance Clause Open End Mortgage
Purchase Details
Closed on
Apr 13, 2005
Sold by
Hansen Jeffery L and Hansen Brenda
Bought by
Hansen Jeffery L and Hansen Gregory E
Purchase Details
Closed on
Apr 6, 2005
Sold by
Hansen Kathryn E
Bought by
Hansen Jeffrey L
Create a Home Valuation Report for This Property
The Home Valuation Report is an in-depth analysis detailing your home's value as well as a comparison with similar homes in the area
Home Values in the Area
Average Home Value in this Area
Purchase History
| Date | Buyer | Sale Price | Title Company |
|---|---|---|---|
| Walker Michael S | $32,000 | Security Title Service | |
| Allen Daniel R | $39,500 | None Available | |
| Hansen Jeffery L | -- | -- | |
| Hansen Jeffrey L | -- | -- |
Source: Public Records
Mortgage History
| Date | Status | Borrower | Loan Amount |
|---|---|---|---|
| Closed | Walker Michael S | $48,486 | |
| Previous Owner | Allen Daniel R | $35,500 |
Source: Public Records
Tax History Compared to Growth
Tax History
| Year | Tax Paid | Tax Assessment Tax Assessment Total Assessment is a certain percentage of the fair market value that is determined by local assessors to be the total taxable value of land and additions on the property. | Land | Improvement |
|---|---|---|---|---|
| 2024 | $565 | $5,968 | $692 | $5,276 |
| 2023 | $565 | $5,684 | $692 | $4,992 |
| 2022 | $515 | $5,413 | $692 | $4,721 |
| 2021 | $518 | $5,413 | $692 | $4,721 |
| 2020 | $510 | $5,392 | $692 | $4,700 |
| 2019 | $491 | $5,135 | $692 | $4,443 |
| 2018 | $488 | $5,041 | $692 | $4,349 |
| 2017 | $494 | $5,041 | $692 | $4,349 |
| 2016 | $523 | $5,280 | $692 | $4,588 |
| 2015 | $327 | $4,286 | $553 | $3,733 |
| 2014 | $320 | $4,276 | $553 | $3,723 |
Source: Public Records
Map
Nearby Homes
- 525 Monument Rd
- 216 N 12th St Unit 840
- 213 N 10th St
- 214 Virginia Ave
- 410 Drake Dr
- 310 N 7th St Unit 660
- 106 Elmwood Ave
- 202 N 7th St
- 409 N 5th St
- 121 Hillside Ave
- 417 N 3rd St
- 800 Sugar Maple Dr
- 734 E Albany Ave
- 1013 N 7th St
- 310 S 9th St
- 920 N 4th St
- 1412 Donahoe Dr
- 408 S 4th St
- 1008 N 1st St
- 701 S 8th St