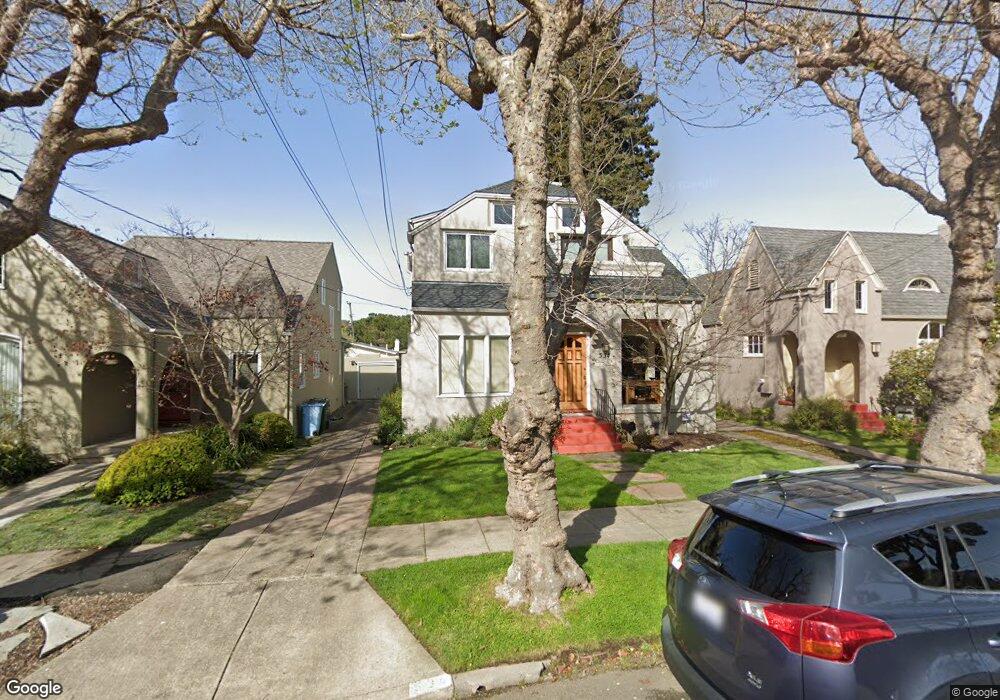
534 Neilson St Berkeley, CA 94707
Thousand Oaks NeighborhoodEstimated Value: $1,721,000 - $2,130,000
4
Beds
3
Baths
2,201
Sq Ft
$861/Sq Ft
Est. Value
About This Home
This home is located at 534 Neilson St, Berkeley, CA 94707 and is currently estimated at $1,895,401, approximately $861 per square foot. 534 Neilson St is a home located in Alameda County with nearby schools including Thousand Oaks Elementary School, Ruth Acty Elementary, and Berkeley Arts Magnet at Whittier School.
Ownership History
Date
Name
Owned For
Owner Type
Purchase Details
Closed on
Feb 4, 1999
Sold by
Etzel Frederick M and Etzel Diane P
Bought by
Etzel Frederick M and Etzel Diane P
Current Estimated Value
Purchase Details
Closed on
Mar 8, 1996
Sold by
Etzel Frederick M and Etzel Diane P
Bought by
Etzel Frederick M and Etzel Diane P
Purchase Details
Closed on
Feb 17, 1995
Sold by
Etzel Frederick M and Etzel Diane P
Bought by
Etzel Frederick M and Etzel Diane P
Create a Home Valuation Report for This Property
The Home Valuation Report is an in-depth analysis detailing your home's value as well as a comparison with similar homes in the area
Home Values in the Area
Average Home Value in this Area
Purchase History
| Date | Buyer | Sale Price | Title Company |
|---|---|---|---|
| Etzel Frederick M | -- | -- | |
| Etzel Frederick M | -- | Fidelity National Title Ins | |
| Etzel Frederick M | -- | -- |
Source: Public Records
Tax History
| Year | Tax Paid | Tax Assessment Tax Assessment Total Assessment is a certain percentage of the fair market value that is determined by local assessors to be the total taxable value of land and additions on the property. | Land | Improvement |
|---|---|---|---|---|
| 2025 | $7,839 | $280,634 | $154,994 | $132,640 |
| 2024 | $7,839 | $274,994 | $151,955 | $130,039 |
| 2023 | $7,587 | $276,466 | $148,976 | $127,490 |
| 2022 | $7,319 | $264,045 | $146,055 | $124,990 |
| 2021 | $7,289 | $258,731 | $143,191 | $122,540 |
| 2020 | $6,747 | $263,007 | $141,723 | $121,284 |
| 2019 | $6,308 | $257,850 | $138,944 | $118,906 |
| 2018 | $6,148 | $252,795 | $136,220 | $116,575 |
| 2017 | $5,910 | $247,839 | $133,550 | $114,289 |
| 2016 | $5,587 | $242,981 | $130,932 | $112,049 |
| 2015 | $5,485 | $239,332 | $128,966 | $110,366 |
| 2014 | $5,386 | $234,644 | $126,440 | $108,204 |
Source: Public Records
Map
Nearby Homes
- 415 Berkeley Park Blvd
- 118 Ramona Ave
- 145 Ramona Ave
- 491 Vincente Ave
- 753 Peralta Ave
- 1858 San Lorenzo Ave
- 1266 Washington Ave
- 712 Masonic Ave
- 417 Evelyn Ave Unit 205
- 1236 Portland Ave
- 840 Key Route Blvd
- 305 Coronado St
- 423 Norvell St
- 1983 Yosemite Rd
- 443 Albemarle St
- 589 San Luis Rd
- 1498 Sonoma Ave
- 605 San Pablo Ave
- 848 Stannage Ave Unit 11
- 483 Boynton Ave
Your Personal Tour Guide
Ask me questions while you tour the home.