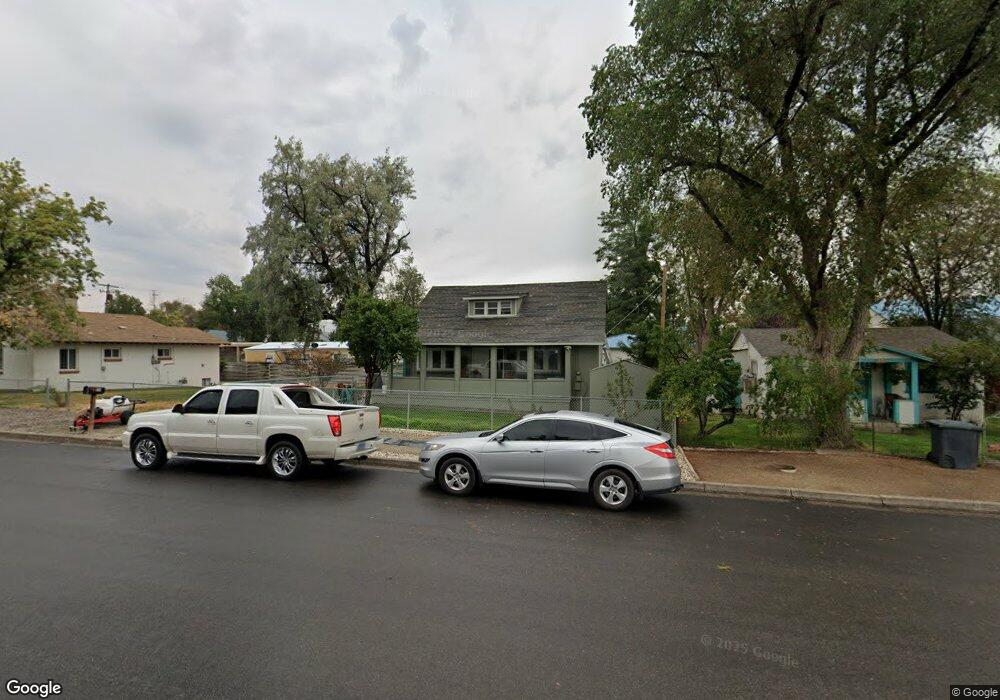
534 Pavilion St Winnemucca, NV 89445
Estimated Value: $218,923 - $342,000
4
Beds
1
Bath
1,825
Sq Ft
$163/Sq Ft
Est. Value
About This Home
This home is located at 534 Pavilion St, Winnemucca, NV 89445 and is currently estimated at $296,731, approximately $162 per square foot. 534 Pavilion St is a home located in Humboldt County with nearby schools including Sonoma Heights Elementary School, Winnemucca Junior High School, and French Ford Middle School.
Ownership History
Date
Name
Owned For
Owner Type
Purchase Details
Closed on
Oct 26, 2006
Sold by
Rossi Leroy
Bought by
Magana Manuel and Magana Elvia
Current Estimated Value
Home Financials for this Owner
Home Financials are based on the most recent Mortgage that was taken out on this home.
Original Mortgage
$150,000
Outstanding Balance
$88,550
Interest Rate
6.36%
Estimated Equity
$208,181
Purchase Details
Closed on
Jun 21, 2005
Sold by
Rossi Danna
Bought by
Rossi Leroy
Home Financials for this Owner
Home Financials are based on the most recent Mortgage that was taken out on this home.
Original Mortgage
$75,000
Interest Rate
7.43%
Mortgage Type
Stand Alone First
Purchase Details
Closed on
Jun 10, 2005
Sold by
Schweigert Robert N and Schweigert Candace J
Bought by
Rossi Leroy
Home Financials for this Owner
Home Financials are based on the most recent Mortgage that was taken out on this home.
Original Mortgage
$75,000
Interest Rate
7.43%
Mortgage Type
Stand Alone First
Create a Home Valuation Report for This Property
The Home Valuation Report is an in-depth analysis detailing your home's value as well as a comparison with similar homes in the area
Home Values in the Area
Average Home Value in this Area
Purchase History
| Date | Buyer | Sale Price | Title Company |
|---|---|---|---|
| Magana Manuel | -- | Western Title Company | |
| Rossi Leroy | $75,000 | Western Title Company Inc | |
| Rossi Leroy | $75,000 | Western Title Company Inc |
Source: Public Records
Mortgage History
| Date | Status | Borrower | Loan Amount |
|---|---|---|---|
| Open | Magana Manuel | $150,000 | |
| Previous Owner | Rossi Leroy | $75,000 | |
| Previous Owner | Rossi Leroy | $75,000 |
Source: Public Records
Tax History Compared to Growth
Tax History
| Year | Tax Paid | Tax Assessment Tax Assessment Total Assessment is a certain percentage of the fair market value that is determined by local assessors to be the total taxable value of land and additions on the property. | Land | Improvement |
|---|---|---|---|---|
| 2025 | $820 | $26,514 | $7,175 | $19,339 |
| 2024 | $800 | $26,239 | $7,175 | $19,063 |
| 2023 | $800 | $24,696 | $7,175 | $17,521 |
| 2022 | $760 | $21,666 | $7,175 | $14,491 |
| 2021 | $741 | $21,335 | $7,175 | $14,160 |
| 2020 | $723 | $20,112 | $5,950 | $14,162 |
| 2019 | $705 | $18,826 | $5,950 | $12,876 |
| 2018 | $687 | $18,263 | $5,950 | $12,313 |
| 2017 | $680 | $18,025 | $5,950 | $12,075 |
| 2016 | $675 | $17,841 | $5,950 | $11,891 |
| 2015 | $612 | $17,511 | $5,950 | $11,561 |
| 2014 | $612 | $17,096 | $5,950 | $11,146 |
Source: Public Records
Map
Nearby Homes