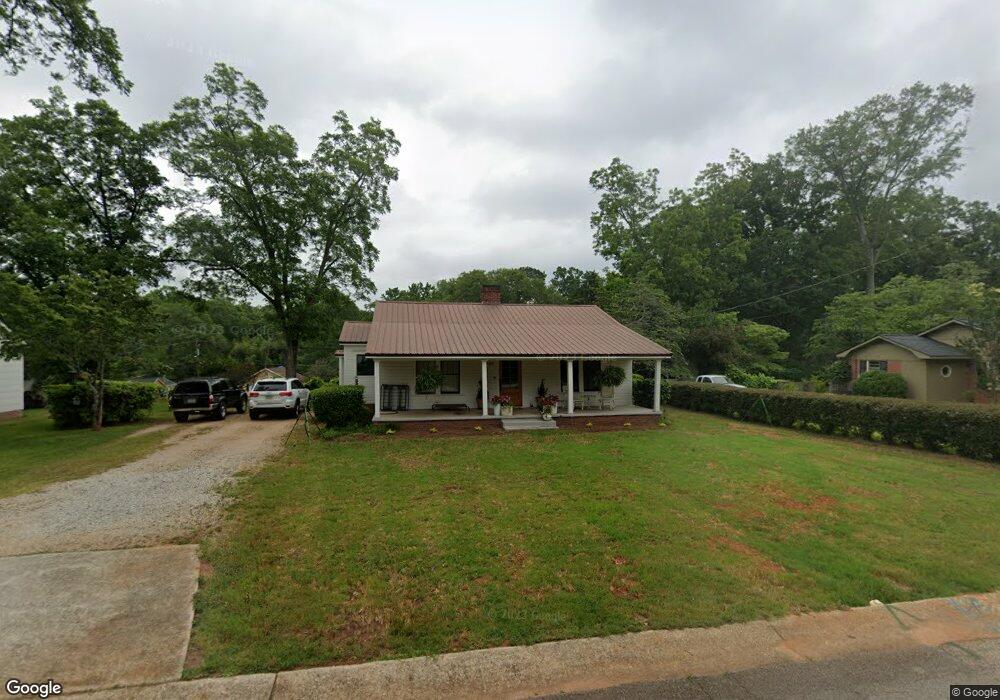
534 Plum St Madison, GA 30650
Estimated Value: $245,000 - $388,000
--
Bed
1
Bath
1,320
Sq Ft
$227/Sq Ft
Est. Value
About This Home
This home is located at 534 Plum St, Madison, GA 30650 and is currently estimated at $299,820, approximately $227 per square foot. 534 Plum St is a home located in Morgan County with nearby schools including Morgan County Primary School, Morgan County Elementary School, and Morgan County Middle School.
Ownership History
Date
Name
Owned For
Owner Type
Purchase Details
Closed on
Oct 4, 2022
Sold by
Bohlen Mack B
Bought by
Wood Margaret Christine and Wood Brandon
Current Estimated Value
Home Financials for this Owner
Home Financials are based on the most recent Mortgage that was taken out on this home.
Original Mortgage
$214,000
Interest Rate
6.95%
Mortgage Type
New Conventional
Purchase Details
Closed on
Jan 1, 2022
Sold by
Bohlen Wilbur
Bought by
Wood Margaret Christine and Wood Brandon
Purchase Details
Closed on
Jan 21, 2016
Sold by
Bohlen Della Mae
Bought by
Bohlen Wilbur
Purchase Details
Closed on
Nov 27, 2012
Sold by
Bohlen Della Mae
Bought by
Bohlen Della Mae
Purchase Details
Closed on
Jun 24, 1996
Sold by
Bohlen Wilbur
Bought by
Bohlen Della Mae
Purchase Details
Closed on
Feb 17, 1947
Sold by
Bohlen Kate Spears
Bought by
Bohlen Wilbur
Create a Home Valuation Report for This Property
The Home Valuation Report is an in-depth analysis detailing your home's value as well as a comparison with similar homes in the area
Home Values in the Area
Average Home Value in this Area
Purchase History
| Date | Buyer | Sale Price | Title Company |
|---|---|---|---|
| Wood Margaret Christine | -- | -- | |
| Wood Margaret Christine | -- | -- | |
| Bohlen Wilbur | -- | -- | |
| Bohlen Della Mae | -- | -- | |
| Bohlen Della Mae | -- | -- | |
| Bohlen Wilbur | $5,500 | -- |
Source: Public Records
Mortgage History
| Date | Status | Borrower | Loan Amount |
|---|---|---|---|
| Previous Owner | Wood Margaret Christine | $214,000 |
Source: Public Records
Tax History Compared to Growth
Tax History
| Year | Tax Paid | Tax Assessment Tax Assessment Total Assessment is a certain percentage of the fair market value that is determined by local assessors to be the total taxable value of land and additions on the property. | Land | Improvement |
|---|---|---|---|---|
| 2024 | $2,473 | $89,610 | $26,400 | $63,210 |
| 2023 | $2,329 | $82,138 | $25,600 | $56,538 |
| 2022 | $2,190 | $72,975 | $32,000 | $40,975 |
| 2021 | $1,935 | $64,225 | $23,250 | $40,975 |
| 2020 | $1,954 | $64,225 | $23,250 | $40,975 |
| 2019 | $1,985 | $64,225 | $23,250 | $40,975 |
| 2018 | $2,120 | $67,653 | $23,250 | $44,403 |
| 2017 | $2,119 | $66,619 | $23,250 | $43,369 |
| 2016 | $1,970 | $60,456 | $23,250 | $37,206 |
| 2015 | $1,943 | $58,840 | $22,080 | $36,760 |
| 2014 | $1,838 | $57,080 | $17,480 | $39,600 |
| 2013 | -- | $52,560 | $17,480 | $35,080 |
Source: Public Records
Map
Nearby Homes
- 1.19 +/- ACRES Poplar St
- 426 Poplar St
- 1001 Alaina Ave
- 1041 Alaina Ave Unit 69
- 1001 Alaina Ave Unit 71
- 1041 Alaina Ave
- 690 Foster Park Ln
- 601 Foster Park Ln
- 757 Markhams Dr
- .78 +/- acres Poplar St
- 1000 Jacob Prickett Ln
- 1291 Spinnaker Rd
- 811 Foster St
- 411 Old Post Rd
- 665 E Walton St
- 991 Crawford St
- 1033 Crawford St
- 691 Skyline Dr
- 1060 Madison Hills Dr Unit 3
- 1050 Madison Hills Dr Unit 2
- 552 Plum St
- 518 Plum St
- 529 Plum St
- 545 Plum St
- 506 Plum St
- 517 Plum St
- Lot 9 Ponder Way
- 571 Plum St
- TRACT B Sugar Bend Trail
- 1021 Dockside Dr
- 0 Binford Rd Land
- 3251 Doster Rd
- 491 Poplar St
- 1501 Double Bridges Rd
- 1100 Honeysuckle Ln
- 613 Foster St
- 505 Plum St
- 631 Foster St
- 506 Poplar St
- 585 Foster St