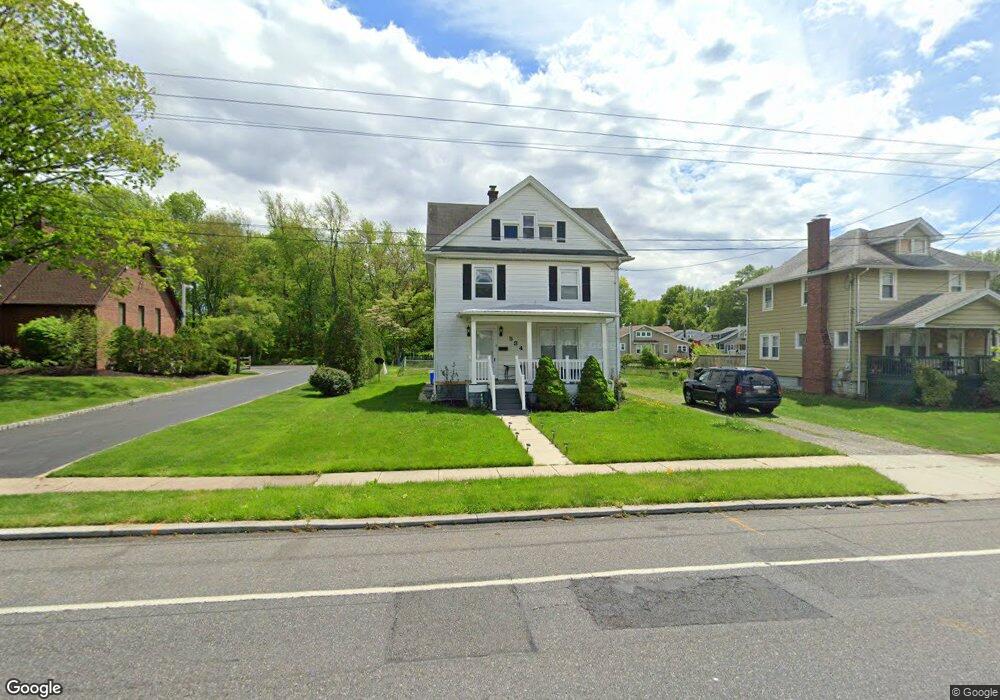
534 Salem Ave Woodbury, NJ 08096
Estimated Value: $272,000 - $327,000
--
Bed
--
Bath
1,568
Sq Ft
$191/Sq Ft
Est. Value
About This Home
This home is located at 534 Salem Ave, Woodbury, NJ 08096 and is currently estimated at $299,699, approximately $191 per square foot. 534 Salem Ave is a home located in Gloucester County with nearby schools including Woodbury Junior/Senior High School and Holy Angels Catholic School.
Ownership History
Date
Name
Owned For
Owner Type
Purchase Details
Closed on
Jul 23, 2019
Sold by
Duczkowski Jennifer
Bought by
Garcia Mauricio Osorio
Current Estimated Value
Purchase Details
Closed on
May 2, 2019
Sold by
Delarosa Asset Management Llc
Bought by
Duczkowski Jennifer
Purchase Details
Closed on
Mar 30, 2019
Sold by
Rodriguez William E
Bought by
Delarosa Asset Management Llc
Purchase Details
Closed on
Mar 26, 2018
Sold by
Administratrix Leslie Mary Elien and Administratrix Jaclinn Kenney
Bought by
Rodriguez William E
Create a Home Valuation Report for This Property
The Home Valuation Report is an in-depth analysis detailing your home's value as well as a comparison with similar homes in the area
Home Values in the Area
Average Home Value in this Area
Purchase History
| Date | Buyer | Sale Price | Title Company |
|---|---|---|---|
| Garcia Mauricio Osorio | $73,000 | None Available | |
| Duczkowski Jennifer | $65,000 | None Available | |
| Delarosa Asset Management Llc | -- | None Available | |
| Rodriguez William E | $32,000 | None Available |
Source: Public Records
Tax History Compared to Growth
Tax History
| Year | Tax Paid | Tax Assessment Tax Assessment Total Assessment is a certain percentage of the fair market value that is determined by local assessors to be the total taxable value of land and additions on the property. | Land | Improvement |
|---|---|---|---|---|
| 2025 | $7,515 | $156,200 | $35,800 | $120,400 |
| 2024 | $7,248 | $156,200 | $35,800 | $120,400 |
| 2023 | $7,248 | $156,200 | $35,800 | $120,400 |
| 2022 | $7,120 | $156,200 | $35,800 | $120,400 |
| 2021 | $7,026 | $156,200 | $35,800 | $120,400 |
| 2020 | $6,335 | $128,300 | $40,100 | $88,200 |
| 2019 | $6,122 | $128,300 | $40,100 | $88,200 |
| 2018 | $5,986 | $128,300 | $40,100 | $88,200 |
| 2017 | $5,885 | $128,300 | $40,100 | $88,200 |
| 2016 | $5,803 | $128,300 | $40,100 | $88,200 |
| 2015 | $5,708 | $128,300 | $40,100 | $88,200 |
| 2014 | $5,618 | $128,300 | $40,100 | $88,200 |
Source: Public Records
Map
Nearby Homes