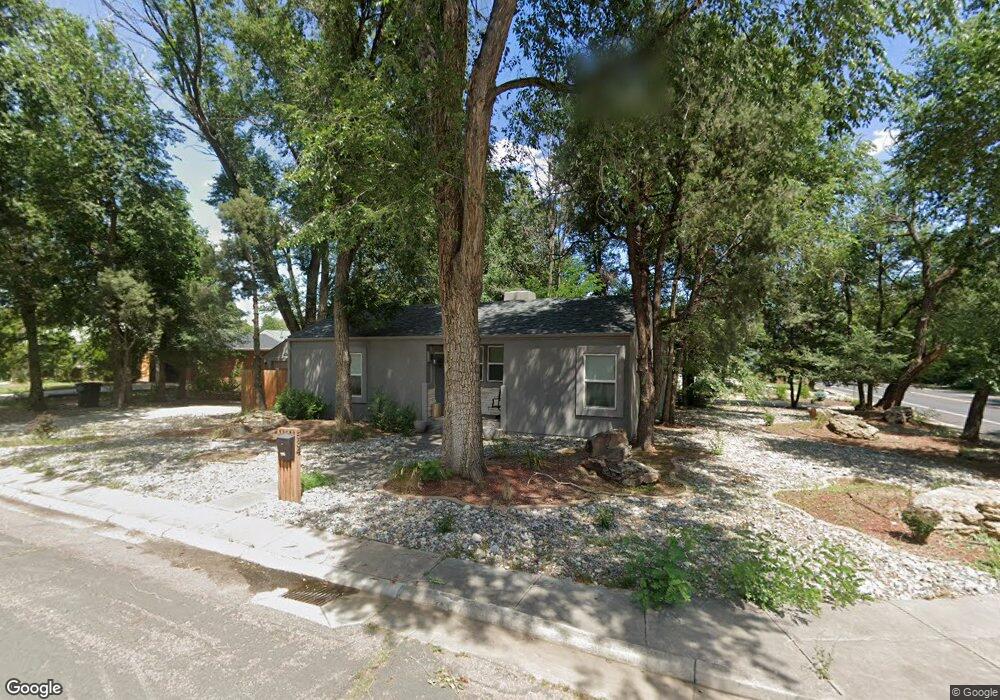
534 W Cheyenne Rd Colorado Springs, CO 80906
Ivywild NeighborhoodEstimated Value: $393,000 - $469,000
3
Beds
3
Baths
1,415
Sq Ft
$306/Sq Ft
Est. Value
About This Home
This home is located at 534 W Cheyenne Rd, Colorado Springs, CO 80906 and is currently estimated at $433,572, approximately $306 per square foot. 534 W Cheyenne Rd is a home located in El Paso County with nearby schools including Broadmoor Elementary School, Cheyenne Mountain Junior High School, and Cheyenne Mountain High School.
Ownership History
Date
Name
Owned For
Owner Type
Purchase Details
Closed on
Sep 7, 2018
Sold by
Hall Ronald F
Bought by
Hall Ronald F and Hall Shirley J
Current Estimated Value
Purchase Details
Closed on
Dec 23, 2016
Sold by
The Foundation For Economic Education In
Bought by
Hall Ronald F
Purchase Details
Closed on
Dec 9, 2016
Sold by
Savage Michelle
Bought by
Foundation For Economic Education
Purchase Details
Closed on
Dec 6, 2016
Sold by
Savage Michelle
Bought by
Economic Education
Purchase Details
Closed on
Jun 30, 1977
Bought by
Hall Ronald F
Purchase Details
Closed on
Oct 31, 1968
Bought by
Hall Ronald F
Purchase Details
Closed on
Jan 16, 1964
Bought by
Hall Ronald F
Create a Home Valuation Report for This Property
The Home Valuation Report is an in-depth analysis detailing your home's value as well as a comparison with similar homes in the area
Home Values in the Area
Average Home Value in this Area
Purchase History
| Date | Buyer | Sale Price | Title Company |
|---|---|---|---|
| Hall Ronald F | -- | Capstone Title | |
| Hall Ronald F | $170,000 | Land Title Guarantee | |
| Foundation For Economic Education | -- | None Available | |
| Economic Education | -- | None Available | |
| Hall Ronald F | -- | -- | |
| Hall Ronald F | -- | -- | |
| Hall Ronald F | -- | -- |
Source: Public Records
Tax History Compared to Growth
Tax History
| Year | Tax Paid | Tax Assessment Tax Assessment Total Assessment is a certain percentage of the fair market value that is determined by local assessors to be the total taxable value of land and additions on the property. | Land | Improvement |
|---|---|---|---|---|
| 2025 | $1,893 | $32,820 | -- | -- |
| 2024 | $1,793 | $31,320 | $9,020 | $22,300 |
| 2022 | $1,229 | $18,040 | $7,460 | $10,580 |
| 2021 | $1,298 | $18,550 | $7,670 | $10,880 |
| 2020 | $1,137 | $15,840 | $6,410 | $9,430 |
| 2019 | $1,124 | $15,840 | $6,410 | $9,430 |
| 2018 | $964 | $13,340 | $5,130 | $8,210 |
| 2017 | $960 | $13,340 | $5,130 | $8,210 |
| 2016 | $473 | $13,490 | $5,220 | $8,270 |
| 2015 | $472 | $13,490 | $5,220 | $8,270 |
| 2014 | $438 | $12,490 | $4,930 | $7,560 |
Source: Public Records
Map
Nearby Homes
- 540 N Bear Paw Ln
- 414 W Cheyenne Rd
- 425 W Cheyenne Rd
- 515 S Bear Paw Ln
- 503 Hawthorne Place
- 403 Laclede Ave
- 1824 Lorraine St
- 313 Laclede Ave
- 164 Creekside Ln
- 878 Oxford Ln
- 777 Saturn Dr Unit 301
- 777 Saturn Dr Unit 400
- 777 Saturn Dr Unit 200
- 777 Saturn Dr Unit 409
- 777 Saturn Dr Unit 502
- 2510 Old Broadmoor Rd
- 134 Pierce Dr
- 2501 Old Broadmoor Rd
- 110 Vine St
- 900 Saturn Dr Unit 706
- 530 W Cheyenne Rd
- 535 Three Eagles St
- 525 Three Eagles St
- 600 W Cheyenne Rd
- 555 W Cheyenne Rd
- 515 Three Eagles St
- 618 W Cheyenne Rd
- 513 Three Eagles St
- 520 W Cheyenne Rd
- 525 W Cheyenne Rd
- 609 Three Eagles St
- 524 Three Eagles St
- 602 Three Eagles St
- 507 Three Eagles St
- 518 Three Eagles St
- 620 W Cheyenne Rd
- 603 W Cheyenne Rd
- 608 Three Eagles St
- 615 Three Eagles St
- 516 W Cheyenne Rd