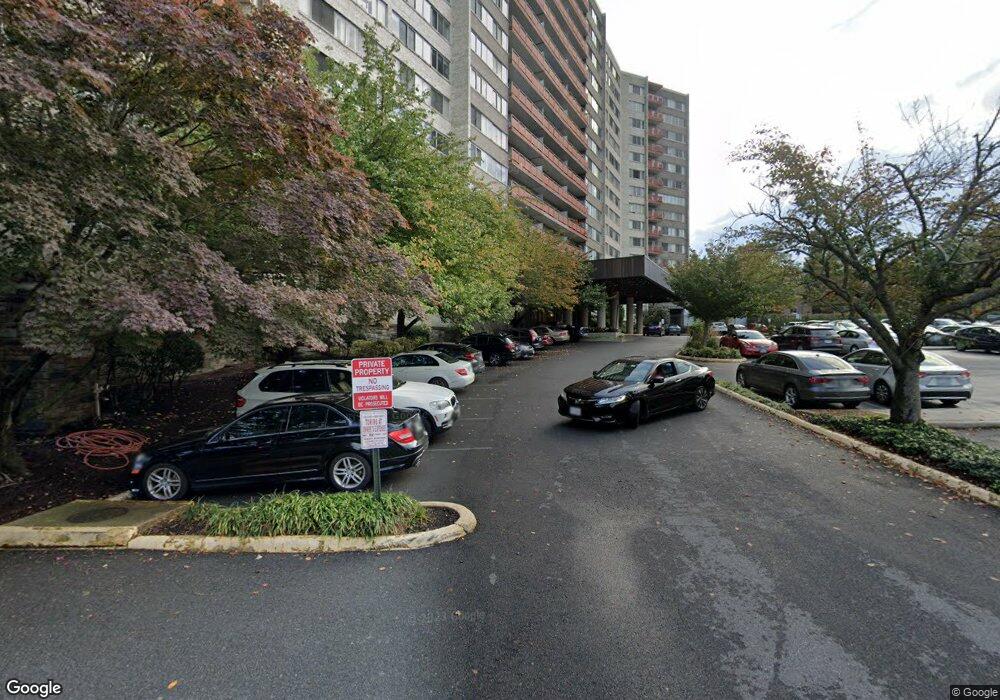
The Pavilion on the Park 5340 Holmes Run Pkwy Unit 1201 Alexandria, VA 22304
Landmark NeighborhoodEstimated Value: $224,000 - $236,232
2
Beds
1
Bath
849
Sq Ft
$273/Sq Ft
Est. Value
About This Home
This home is located at 5340 Holmes Run Pkwy Unit 1201, Alexandria, VA 22304 and is currently estimated at $231,411, approximately $272 per square foot. 5340 Holmes Run Pkwy Unit 1201 is a home located in Alexandria City with nearby schools including Patrick Henry Elementary School, Alexandria City High School, and Queen of Apostles Catholic School.
Ownership History
Date
Name
Owned For
Owner Type
Purchase Details
Closed on
Jun 16, 2008
Sold by
U S Bank N A As Trustee
Bought by
Marquez Angelica D
Current Estimated Value
Home Financials for this Owner
Home Financials are based on the most recent Mortgage that was taken out on this home.
Original Mortgage
$142,110
Outstanding Balance
$91,749
Interest Rate
6.17%
Mortgage Type
New Conventional
Estimated Equity
$139,662
Purchase Details
Closed on
Oct 10, 1995
Sold by
Krevor June S
Bought by
Bolanos Jose L
Home Financials for this Owner
Home Financials are based on the most recent Mortgage that was taken out on this home.
Original Mortgage
$3,000
Interest Rate
7.86%
Purchase Details
Closed on
Sep 6, 1995
Sold by
Long Young Janet L
Bought by
Krevor June S
Home Financials for this Owner
Home Financials are based on the most recent Mortgage that was taken out on this home.
Original Mortgage
$3,000
Interest Rate
7.86%
Create a Home Valuation Report for This Property
The Home Valuation Report is an in-depth analysis detailing your home's value as well as a comparison with similar homes in the area
Home Values in the Area
Average Home Value in this Area
Purchase History
| Date | Buyer | Sale Price | Title Company |
|---|---|---|---|
| Marquez Angelica D | $157,900 | -- | |
| Bolanos Jose L | $72,400 | -- | |
| Krevor June S | $72,400 | -- |
Source: Public Records
Mortgage History
| Date | Status | Borrower | Loan Amount |
|---|---|---|---|
| Open | Marquez Angelica D | $142,110 | |
| Previous Owner | Krevor June S | $3,000 |
Source: Public Records
Tax History Compared to Growth
Tax History
| Year | Tax Paid | Tax Assessment Tax Assessment Total Assessment is a certain percentage of the fair market value that is determined by local assessors to be the total taxable value of land and additions on the property. | Land | Improvement |
|---|---|---|---|---|
| 2025 | $2,507 | $223,759 | $60,790 | $162,969 |
| 2024 | $2,507 | $213,104 | $57,895 | $155,209 |
| 2023 | $2,319 | $208,925 | $56,760 | $152,165 |
| 2022 | $2,319 | $208,925 | $56,760 | $152,165 |
| 2021 | $2,167 | $195,257 | $53,047 | $142,210 |
| 2020 | $1,979 | $180,793 | $49,117 | $131,676 |
| 2019 | $1,836 | $162,468 | $44,139 | $118,329 |
| 2018 | $1,836 | $162,468 | $44,139 | $118,329 |
| 2017 | $1,732 | $153,271 | $41,640 | $111,631 |
| 2016 | $1,801 | $167,862 | $41,640 | $126,222 |
| 2015 | $1,751 | $167,862 | $41,640 | $126,222 |
| 2014 | $1,539 | $147,582 | $41,640 | $105,942 |
Source: Public Records
About The Pavilion on the Park
Map
Nearby Homes
- 5340 Holmes Run Pkwy Unit 217
- 5340 Holmes Run Pkwy Unit 107
- 5340 Holmes Run Pkwy Unit 1215
- 5340 Holmes Run Pkwy Unit 700
- 5340 Holmes Run Pkwy Unit 804
- 5340 Holmes Run Pkwy Unit 1119
- 5340 Holmes Run Pkwy Unit 400
- 5340 Holmes Run Pkwy Unit 101
- 5340 Holmes Run Pkwy Unit 1410
- 5340 Holmes Run Pkwy Unit 1102
- 5340 Holmes Run Pkwy Unit 405
- 5300 Holmes Run Pkwy Unit 1210
- 5300 Holmes Run Pkwy Unit 410
- 5300 Holmes Run Pkwy Unit 402
- 5300 Holmes Run Pkwy Unit 506
- 5300 Holmes Run Pkwy Unit 212
- 29 Canterbury Square Unit 201
- 5500 Holmes Run Pkwy Unit 506
- 5500 Holmes Run Pkwy Unit 318
- 1 Canterbury Square Unit 101
- 5340 Holmes Run Pkwy Unit 14th Floor
- 5340 Holmes Run Pkwy Unit 710
- 5340 Holmes Run Pkwy Unit 111
- 5340 Holmes Run Pkwy Unit 1015
- 5340 Holmes Run Pkwy Unit 514
- 5340 Holmes Run Pkwy Unit 314
- 5340 Holmes Run Pkwy Unit 605
- 5340 Holmes Run Pkwy Unit 315
- 5340 Holmes Run Pkwy Unit 1106
- 5340 Holmes Run Pkwy Unit 1412
- 5340 Holmes Run Pkwy Unit 1115
- 5340 Holmes Run Pkwy Unit 201
- 5340 Holmes Run Pkwy Unit 212
- 5340 Holmes Run Pkwy Unit 305
- 5340 Holmes Run Pkwy Unit 419
- 5340 Holmes Run Pkwy Unit 1002
- 5340 Holmes Run Pkwy Unit 915
- 5340 Holmes Run Pkwy Unit 418
- 5340 Holmes Run Pkwy Unit 706
- 5340 Holmes Run Pkwy Unit 219