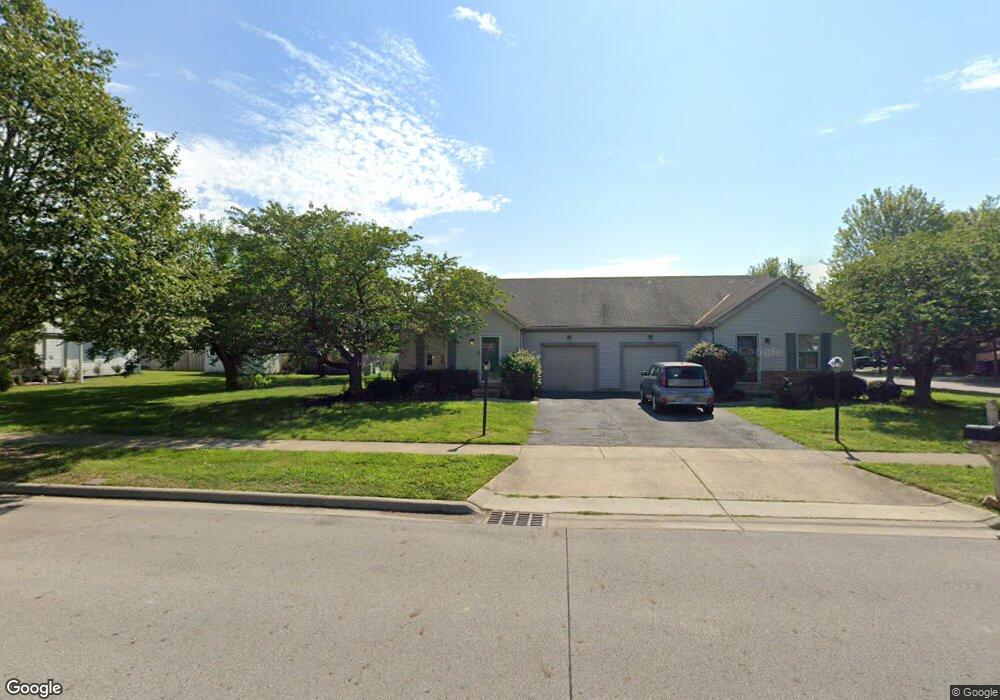
5340 Spring Hill Rd Unit 344 Grove City, OH 43123
Estimated Value: $354,000 - $447,000
4
Beds
2
Baths
2,092
Sq Ft
$189/Sq Ft
Est. Value
About This Home
This home is located at 5340 Spring Hill Rd Unit 344, Grove City, OH 43123 and is currently estimated at $394,592, approximately $188 per square foot. 5340 Spring Hill Rd Unit 344 is a home located in Franklin County with nearby schools including Buckeye Woods Elementary School, Hayes Intermediate School, and Jackson Middle School.
Ownership History
Date
Name
Owned For
Owner Type
Purchase Details
Closed on
Nov 5, 2020
Sold by
Yoakum Joyce I and The Joyce I Yoakam Declaration
Bought by
Harbour Properties Llc
Current Estimated Value
Home Financials for this Owner
Home Financials are based on the most recent Mortgage that was taken out on this home.
Original Mortgage
$320,000
Interest Rate
2.8%
Mortgage Type
Commercial
Purchase Details
Closed on
Apr 21, 2005
Sold by
Yoakam Patrick C and Yoakam Joyce I
Bought by
Yoakam Joyce I and Joyce I Yoakam Declaration Of Trust
Purchase Details
Closed on
Nov 7, 2003
Sold by
Yoakam Patrick C
Bought by
Yoakam Patrick C and Yoakam Joyce I
Home Financials for this Owner
Home Financials are based on the most recent Mortgage that was taken out on this home.
Original Mortgage
$58,550
Interest Rate
6.01%
Mortgage Type
Purchase Money Mortgage
Create a Home Valuation Report for This Property
The Home Valuation Report is an in-depth analysis detailing your home's value as well as a comparison with similar homes in the area
Home Values in the Area
Average Home Value in this Area
Purchase History
| Date | Buyer | Sale Price | Title Company |
|---|---|---|---|
| Harbour Properties Llc | $400,000 | Service Title Agency | |
| Yoakam Joyce I | -- | -- | |
| Yoakam Patrick C | -- | Nations Title Agency Inc |
Source: Public Records
Mortgage History
| Date | Status | Borrower | Loan Amount |
|---|---|---|---|
| Closed | Harbour Properties Llc | $320,000 | |
| Closed | Yoakam Patrick C | $58,550 |
Source: Public Records
Tax History Compared to Growth
Tax History
| Year | Tax Paid | Tax Assessment Tax Assessment Total Assessment is a certain percentage of the fair market value that is determined by local assessors to be the total taxable value of land and additions on the property. | Land | Improvement |
|---|---|---|---|---|
| 2024 | $5,256 | $112,910 | $36,330 | $76,580 |
| 2023 | $5,183 | $112,910 | $36,330 | $76,580 |
| 2022 | $4,059 | $63,880 | $15,930 | $47,950 |
| 2021 | $4,065 | $63,880 | $15,930 | $47,950 |
| 2020 | $4,054 | $63,880 | $15,930 | $47,950 |
| 2019 | $3,649 | $53,270 | $13,300 | $39,970 |
| 2018 | $3,846 | $53,270 | $13,300 | $39,970 |
| 2017 | $3,873 | $53,270 | $13,300 | $39,970 |
| 2016 | $4,054 | $54,460 | $13,160 | $41,300 |
| 2015 | $4,055 | $54,460 | $13,160 | $41,300 |
| 2014 | $4,059 | $54,460 | $13,160 | $41,300 |
| 2013 | $1,827 | $51,870 | $12,530 | $39,340 |
Source: Public Records
Map
Nearby Homes
- 5428 Hoover Rd
- 2328 Hoover Rd
- 5232 Hoover Rd
- 2335 Fernwood Ave
- 2305 Spring Cress Ave
- 2382 Clover Blossom Ct
- 2634 Orders Road Ct
- 0 Hoover Rd
- 2384 Birch Bark Trail
- 3171 Orders Rd
- 2383 Birch Bark Trail
- 5124 Keefer Ln
- 5148 Keefer Ln
- 2310 Tournament Way
- 5351 Lilac Ave
- 2114 Visconti Dr
- 2336 Willowside Ln Unit 2336
- 2720 Loris Way
- 5455 Lilac Ave
- 4881 Primrose Ct
- 2420 Deerfield Dr Unit 424
- 5346 Merrybell Ln
- 5336 Merrybell Ln
- 2460 Deerfield Dr
- 2410 Deerfield Dr Unit 414
- 2439 Deerfield Dr
- 2435 Deerfield Dr
- 2429 Deerfield Dr
- 2435 Merrybell Ct
- 2423 Deerfield Dr
- 5326 Merrybell Ln
- 2435 Merrybell Ln
- 2470 Deerfield Dr
- 2413 Deerfield Dr
- 2459 Deerfield Dr
- 2400 Deerfield Dr Unit 404
- 2419 Deerfield Dr
- 2407 Deerfield Dr
- 5375 Spring Hill Rd
- 5316 Merrybell Ln