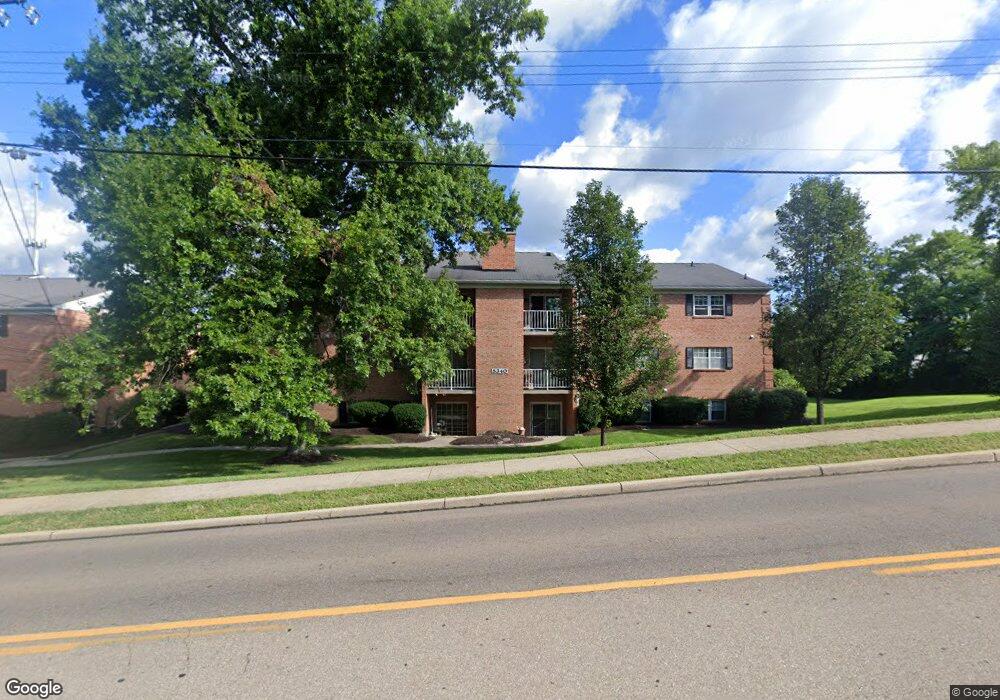
5340 Werk Rd Cincinnati, OH 45248
Estimated Value: $130,000 - $161,415
2
Beds
2
Baths
1,007
Sq Ft
$145/Sq Ft
Est. Value
About This Home
This home is located at 5340 Werk Rd, Cincinnati, OH 45248 and is currently estimated at $146,354, approximately $145 per square foot. 5340 Werk Rd is a home located in Hamilton County with nearby schools including Oakdale Elementary School, Bridgetown Middle School, and Oak Hills High School.
Ownership History
Date
Name
Owned For
Owner Type
Purchase Details
Closed on
Jun 21, 2023
Sold by
Riestenberg Paul and Riestenberg Cherie
Bought by
Henry Melisa C and Henry Kevin
Current Estimated Value
Home Financials for this Owner
Home Financials are based on the most recent Mortgage that was taken out on this home.
Original Mortgage
$142,500
Outstanding Balance
$138,045
Interest Rate
6.35%
Mortgage Type
New Conventional
Estimated Equity
$8,309
Purchase Details
Closed on
Jul 8, 2016
Sold by
Schock Lisa A and Schock Frank H
Bought by
Riestenberg Paul and Riestenberg Cherie
Purchase Details
Closed on
Dec 17, 2013
Sold by
Schock Ruth
Bought by
Schock Lisa A and Graham Frank H
Home Financials for this Owner
Home Financials are based on the most recent Mortgage that was taken out on this home.
Original Mortgage
$37,000
Interest Rate
4.17%
Mortgage Type
New Conventional
Create a Home Valuation Report for This Property
The Home Valuation Report is an in-depth analysis detailing your home's value as well as a comparison with similar homes in the area
Home Values in the Area
Average Home Value in this Area
Purchase History
| Date | Buyer | Sale Price | Title Company |
|---|---|---|---|
| Henry Melisa C | $150,000 | None Listed On Document | |
| Henry Melisa C | $150,000 | None Listed On Document | |
| Riestenberg Paul | $50,000 | -- | |
| Schock Lisa A | $47,000 | Attorney |
Source: Public Records
Mortgage History
| Date | Status | Borrower | Loan Amount |
|---|---|---|---|
| Open | Henry Melisa C | $142,500 | |
| Closed | Henry Melisa C | $142,500 | |
| Previous Owner | Schock Lisa A | $37,000 |
Source: Public Records
Tax History
| Year | Tax Paid | Tax Assessment Tax Assessment Total Assessment is a certain percentage of the fair market value that is determined by local assessors to be the total taxable value of land and additions on the property. | Land | Improvement |
|---|---|---|---|---|
| 2025 | $1,990 | $38,210 | $6,125 | $32,085 |
| 2024 | $1,941 | $38,210 | $6,125 | $32,085 |
| 2023 | $2,009 | $38,210 | $6,125 | $32,085 |
| 2022 | $1,075 | $17,353 | $2,450 | $14,903 |
| 2021 | $988 | $17,353 | $2,450 | $14,903 |
| 2020 | $976 | $17,353 | $2,450 | $14,903 |
| 2019 | $1,083 | $17,500 | $2,450 | $15,050 |
| 2018 | $1,084 | $17,500 | $2,450 | $15,050 |
| 2017 | $1,036 | $17,500 | $2,450 | $15,050 |
| 2016 | $933 | $16,451 | $3,357 | $13,094 |
| 2015 | $940 | $16,451 | $3,357 | $13,094 |
| 2014 | $942 | $16,451 | $3,357 | $13,094 |
| 2013 | $1,297 | $23,275 | $4,725 | $18,550 |
Source: Public Records
Map
Nearby Homes
- 2985 Welge Ln
- 3157 Westbourne Dr
- 5448 Robert Ave
- 2713 Falconbridge Dr
- 2710 Carroll Ave
- 3531 Werk Rd
- 3599 Schwartze Ave
- 2530 Falconbridge Dr
- 3617 Fieldcrest Dr
- 2819 Springwood Ct
- 5465 Childs Ave
- 5487 Belcross Ct
- 3238 Buell St
- 4269 Grotto Ct
- 5584 Green Acres Ct
- 3317 Buell St
- 3445 Robb Ave
- 3230 Stanhope Ave
- 3823 Applegate Ave
- 3281 Pickbury Dr
- 5340 Werk Rd Unit B8
- 5340 Werk Rd Unit B3
- 5340 Werk Rd
- 5340 Werk Rd
- 5340 Werk Rd
- 5340 Werk Rd
- 5340 Werk Rd
- 5340 Werk Rd
- 5340 Werk Rd
- 5340 Werk Rd Unit B5
- 5340 Werk Rd Unit 4
- 5340 Werk Rd Unit B4
- 5340 Werk Rd Unit 2
- 5340 Werk Rd Unit B2
- 5340 Werk Rd Unit 7
- 5340 Werk Rd Unit 1
- 5340 Werk Rd Unit 6
- 5340 Werk Rd Unit 10
- 5340 Werk Rd Unit B6
- 5340 Werk Rd Unit 5
Your Personal Tour Guide
Ask me questions while you tour the home.