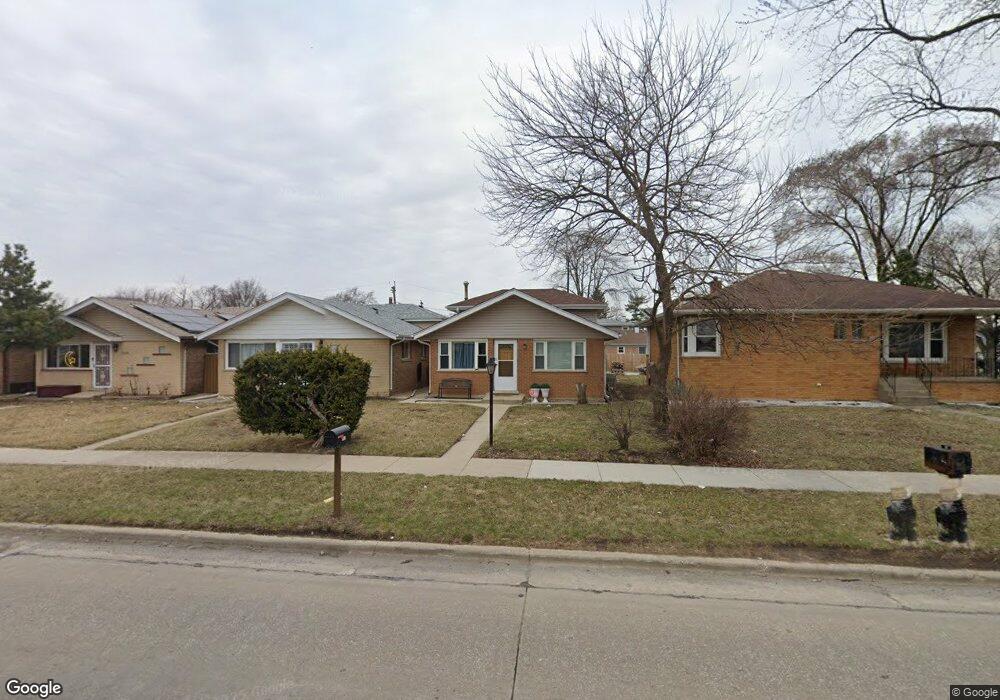
5342 W 87th St Burbank, IL 60459
Estimated Value: $246,000 - $304,000
3
Beds
1
Bath
792
Sq Ft
$356/Sq Ft
Est. Value
About This Home
This home is located at 5342 W 87th St, Burbank, IL 60459 and is currently estimated at $282,201, approximately $356 per square foot. 5342 W 87th St is a home located in Cook County with nearby schools including Luther Burbank Elementary School, Reavis High School, and St Gerald School.
Ownership History
Date
Name
Owned For
Owner Type
Purchase Details
Closed on
Jul 8, 2024
Sold by
Florek Wladyslaw and Florek Danuta Slodyczka
Bought by
Florek Wladyslaw and Florek Danuta Slodyczka
Current Estimated Value
Purchase Details
Closed on
May 22, 1997
Sold by
Ithal Alan E and Ithal Catherine M
Bought by
Florek Wladyslaw and Florek Danuta Slodyczka
Home Financials for this Owner
Home Financials are based on the most recent Mortgage that was taken out on this home.
Original Mortgage
$97,800
Interest Rate
8.17%
Purchase Details
Closed on
Jan 13, 1994
Sold by
Maritato Jennie
Bought by
Ithal Alan E and Ithal Catherine M
Home Financials for this Owner
Home Financials are based on the most recent Mortgage that was taken out on this home.
Original Mortgage
$90,200
Interest Rate
7.31%
Create a Home Valuation Report for This Property
The Home Valuation Report is an in-depth analysis detailing your home's value as well as a comparison with similar homes in the area
Home Values in the Area
Average Home Value in this Area
Purchase History
| Date | Buyer | Sale Price | Title Company |
|---|---|---|---|
| Florek Wladyslaw | -- | None Listed On Document | |
| Florek Wladyslaw | $103,000 | -- | |
| Ithal Alan E | $63,333 | -- |
Source: Public Records
Mortgage History
| Date | Status | Borrower | Loan Amount |
|---|---|---|---|
| Previous Owner | Florek Wladyslaw | $97,800 | |
| Previous Owner | Ithal Alan E | $90,200 |
Source: Public Records
Tax History Compared to Growth
Tax History
| Year | Tax Paid | Tax Assessment Tax Assessment Total Assessment is a certain percentage of the fair market value that is determined by local assessors to be the total taxable value of land and additions on the property. | Land | Improvement |
|---|---|---|---|---|
| 2024 | $4,974 | $22,001 | $3,563 | $18,438 |
| 2023 | $3,908 | $22,001 | $3,563 | $18,438 |
| 2022 | $3,908 | $16,976 | $3,094 | $13,882 |
| 2021 | $5,035 | $16,975 | $3,093 | $13,882 |
| 2020 | $4,939 | $16,975 | $3,093 | $13,882 |
| 2019 | $4,390 | $15,683 | $2,812 | $12,871 |
| 2018 | $4,263 | $15,683 | $2,812 | $12,871 |
| 2017 | $4,142 | $15,683 | $2,812 | $12,871 |
| 2016 | $4,561 | $15,441 | $2,343 | $13,098 |
| 2015 | $4,348 | $15,441 | $2,343 | $13,098 |
| 2014 | $4,235 | $15,441 | $2,343 | $13,098 |
| 2013 | $4,162 | $16,474 | $2,343 | $14,131 |
Source: Public Records
Map
Nearby Homes
- 8650 Lockwood Ave
- 8528 Lorel Ave
- 5400 W 85th St
- 5175 W 88th Place
- 8638 Central Ave
- 8605 Leclaire Ave
- 5306 Kimball Place
- 8758 Central Ave
- 8558 Parkside Ave
- 8762 Central Ave
- 5610 W 85th St
- 8506 Parkside Ave
- 5613 W 84th Place
- 8737 Sproat Ave Unit 2
- 5500 W 90th St
- 5649 W 87th Place
- 8525 Massasoit Ave
- 4931 W 87th St Unit 49313SW
- 5316 Otto Place
- 5368 Otto Place
- 5344 W 87th St
- 5340 W 87th St
- 5346 W 87th St
- 5348 W 87th St
- 8636 Lorel Ave
- 5352 W 87th St
- 5356 W 87 St
- 5360 W 87th St
- 5356 W 87th St
- 8632 Lorel Ave
- 8632 Lorel Ave
- 8631 Long Ave
- 8631 Long Ave
- 8631 Long Ave
- 5330 W 87th St
- 5247 W 87th St Unit 2
- 8628 Lorel Ave
- 8628 Lorel Ave
- 5243 W 87th St
- 8629 Long Ave