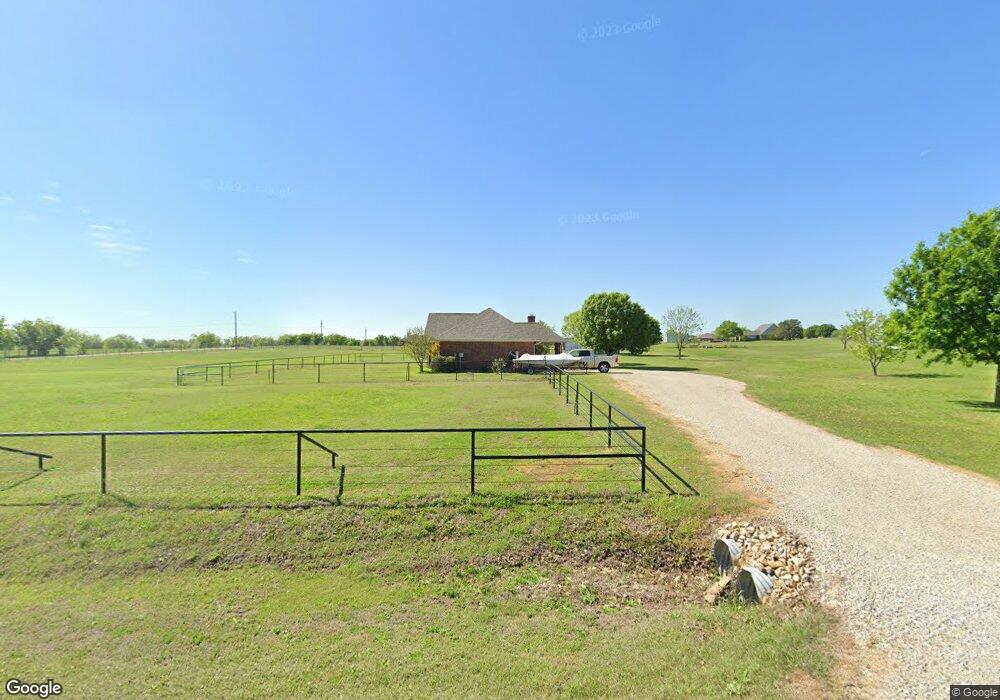
5343 Down Wind Ln Sanger, TX 76266
Estimated Value: $332,000 - $539,000
3
Beds
2
Baths
1,514
Sq Ft
$297/Sq Ft
Est. Value
About This Home
This home is located at 5343 Down Wind Ln, Sanger, TX 76266 and is currently estimated at $449,066, approximately $296 per square foot. 5343 Down Wind Ln is a home located in Denton County with nearby schools including Chisholm Trail Elementary School, Clear Creek Intermediate School, and Sanger Sixth Grade Campus.
Ownership History
Date
Name
Owned For
Owner Type
Purchase Details
Closed on
Mar 23, 1999
Sold by
Whitworth Jonathan L and Whitworth Amy
Bought by
Green Rickie O and Green Barbara H
Current Estimated Value
Home Financials for this Owner
Home Financials are based on the most recent Mortgage that was taken out on this home.
Original Mortgage
$95,000
Outstanding Balance
$22,640
Interest Rate
6.82%
Mortgage Type
Purchase Money Mortgage
Estimated Equity
$426,426
Purchase Details
Closed on
Aug 15, 1994
Sold by
Steinke Harold and Steinke Carolyn
Bought by
Whitworth Jonathan L and Whitworth Amy R
Home Financials for this Owner
Home Financials are based on the most recent Mortgage that was taken out on this home.
Original Mortgage
$11,200
Interest Rate
8.52%
Mortgage Type
Purchase Money Mortgage
Purchase Details
Closed on
Dec 31, 1993
Sold by
First State Bank
Bought by
Steinke Harold and Steinke Carolyn
Home Financials for this Owner
Home Financials are based on the most recent Mortgage that was taken out on this home.
Original Mortgage
$6,000
Interest Rate
7.23%
Mortgage Type
Purchase Money Mortgage
Create a Home Valuation Report for This Property
The Home Valuation Report is an in-depth analysis detailing your home's value as well as a comparison with similar homes in the area
Home Values in the Area
Average Home Value in this Area
Purchase History
| Date | Buyer | Sale Price | Title Company |
|---|---|---|---|
| Green Rickie O | -- | -- | |
| Green Rickie O | -- | -- | |
| Whitworth Jonathan L | -- | -- | |
| Whitworth Jonathan L | -- | -- | |
| Steinke Harold | -- | First American Title Ins | |
| Steinke Harold | -- | First American Title Ins |
Source: Public Records
Mortgage History
| Date | Status | Borrower | Loan Amount |
|---|---|---|---|
| Open | Green Rickie O | $95,000 | |
| Closed | Green Rickie O | $95,000 | |
| Previous Owner | Whitworth Jonathan L | $11,200 | |
| Previous Owner | Steinke Harold | $6,000 |
Source: Public Records
Tax History
| Year | Tax Paid | Tax Assessment Tax Assessment Total Assessment is a certain percentage of the fair market value that is determined by local assessors to be the total taxable value of land and additions on the property. | Land | Improvement |
|---|---|---|---|---|
| 2025 | $531 | $390,004 | $182,431 | $279,499 |
| 2024 | $4,812 | $354,549 | $0 | $0 |
| 2023 | $529 | $322,317 | $182,431 | $322,883 |
| 2022 | $4,860 | $293,015 | $177,517 | $200,896 |
| 2021 | $3,887 | $266,377 | $98,381 | $167,996 |
| 2020 | $4,291 | $273,108 | $98,381 | $174,727 |
| 2019 | $4,101 | $250,558 | $98,381 | $178,023 |
| 2018 | $3,392 | $205,718 | $58,587 | $147,131 |
| 2017 | $3,399 | $204,683 | $58,587 | $149,097 |
| 2016 | $2,994 | $180,334 | $43,614 | $136,720 |
| 2015 | $2,793 | $177,797 | $43,614 | $134,183 |
| 2014 | $2,793 | $178,068 | $43,614 | $134,454 |
| 2013 | -- | $174,574 | $43,614 | $130,960 |
Source: Public Records
Map
Nearby Homes
- 6807 Sam Bass Rd
- 9061 Crow Wright Rd
- TBD Michael Rd
- 8875 Fm 2450
- 6044 Mango Dr
- 6033 Mango Dr
- 6009 Amber Dr
- 6210 Deer Run Rd
- 6221 Deer Run Rd
- 14158 Crest View Rd
- 6037 Amber Dr
- 6400 Ridgerock Dr
- 6041 Amber Dr
- 7140 Davidson Rd
- TBD Fm 2164
- TBD Switzer Rd
- TBD Gregory Rd
- TBD Hoehn Rd
- . Fm 2450 & Indian Trail
- 6958 Michael Rd
- 7 Sam Bass Rd
- 6 Sam Bass Rd
- 5 Sam Bass Rd
- 4 Sam Bass Rd
- 3 Sam Bass Rd
- 8156 Airfield Dr
- 5336 Down Wind Ln
- 5316 Down Wind Ln
- 8045 Airfield Dr
- 6265 Sam Bass Rd
- 8096 Airfield Dr
- 6595 Sam Bass Rd
- 7993 Airfield Dr
- 7929 Airfield Dr
- 8018 Airfield Dr
- 6201 Sam Bass Rd
- 7915 Airfield Dr
- 7911 Airfield Dr
- 7922 Airfield Dr
- 7837 Airfield Dr
Your Personal Tour Guide
Ask me questions while you tour the home.