Estimated Value: $359,000 - $401,000
3
Beds
2
Baths
1,398
Sq Ft
$274/Sq Ft
Est. Value
About This Home
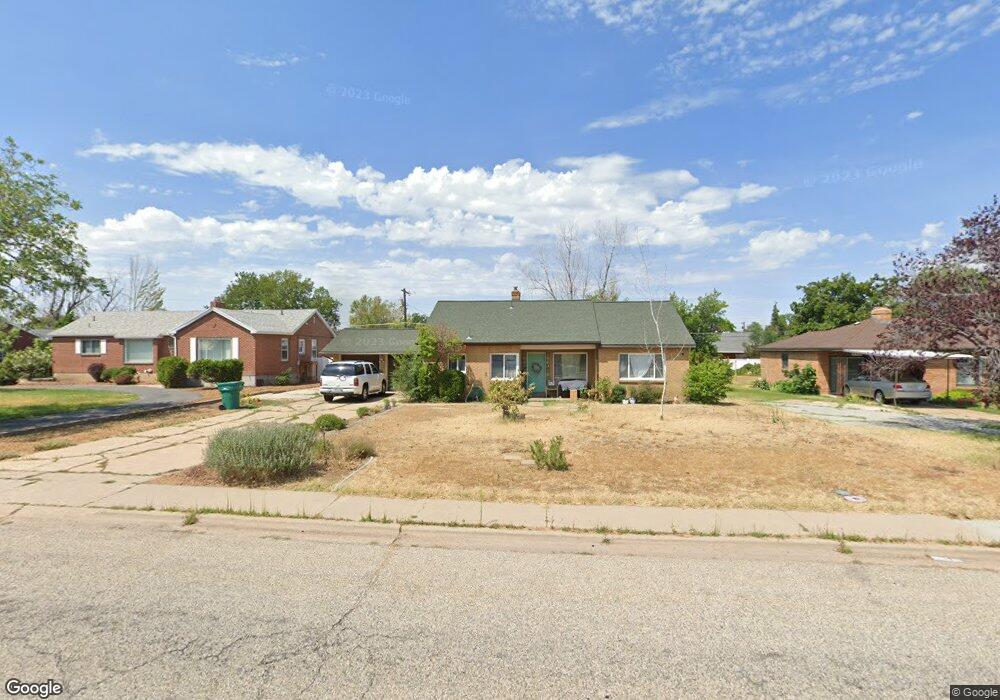
This home is located at 5343 S 2000 W, Roy, UT 84067 and is currently estimated at $383,630, approximately $274 per square foot. 5343 S 2000 W is a home located in Weber County with nearby schools including Lakeview Elementary School, Roy Junior High School, and Roy High School.
Ownership History
Date
Name
Owned For
Owner Type
Purchase Details
Closed on
Apr 9, 2015
Sold by
Mcfarland James R and Republic Mortgage Home Loans L
Bought by
Christiana Trust and Bcat 2014 4Tt
Current Estimated Value
Purchase Details
Closed on
Apr 25, 2008
Sold by
Mcfarland Jaimee R
Bought by
Mcfarland Gary L
Home Financials for this Owner
Home Financials are based on the most recent Mortgage that was taken out on this home.
Original Mortgage
$152,351
Interest Rate
5.81%
Mortgage Type
New Conventional
Purchase Details
Closed on
Aug 1, 2006
Sold by
Bringard Jaimee and Mcfarland Jaimee R
Bought by
Mcfarland Gary L
Purchase Details
Closed on
Jun 19, 2003
Sold by
Stevens Darlene C
Bought by
Bringard Jaimee
Home Financials for this Owner
Home Financials are based on the most recent Mortgage that was taken out on this home.
Original Mortgage
$102,800
Interest Rate
5.37%
Mortgage Type
Purchase Money Mortgage
Purchase Details
Closed on
Jan 10, 2003
Sold by
Garnett Russell John R and Garnett Russell Minnie
Bought by
Stevens Darlene C
Create a Home Valuation Report for This Property
The Home Valuation Report is an in-depth analysis detailing your home's value as well as a comparison with similar homes in the area
Home Values in the Area
Average Home Value in this Area
Purchase History
| Date | Buyer | Sale Price | Title Company |
|---|---|---|---|
| Christiana Trust | $108,000 | Orange Title Ins Agency | |
| Mcfarland Gary L | -- | Inwest Title Ogden | |
| Mcfarland Jaimee R | -- | Inwest Title Ogden | |
| Mcfarland Gary L | -- | Executive Title | |
| Bringard Jaimee | -- | Us Title | |
| Stevens Darlene C | -- | Intermountain Title |
Source: Public Records
Mortgage History
| Date | Status | Borrower | Loan Amount |
|---|---|---|---|
| Previous Owner | Mcfarland Jaimee R | $152,351 | |
| Previous Owner | Bringard Jaimee | $102,800 |
Source: Public Records
Tax History
| Year | Tax Paid | Tax Assessment Tax Assessment Total Assessment is a certain percentage of the fair market value that is determined by local assessors to be the total taxable value of land and additions on the property. | Land | Improvement |
|---|---|---|---|---|
| 2025 | $345 | $359,691 | $126,265 | $233,426 |
| 2024 | $2,258 | $194,699 | $69,446 | $125,253 |
| 2023 | $431 | $191,950 | $65,733 | $126,217 |
| 2022 | $499 | $183,150 | $56,725 | $126,425 |
| 2021 | $459 | $254,000 | $72,748 | $181,252 |
| 2020 | $1,597 | $212,000 | $72,748 | $139,252 |
| 2019 | $1,588 | $199,000 | $42,353 | $156,647 |
| 2018 | $1,430 | $167,000 | $37,151 | $129,849 |
| 2017 | $1,403 | $154,000 | $37,151 | $116,849 |
| 2016 | $1,251 | $72,820 | $17,020 | $55,800 |
| 2015 | $1,190 | $70,879 | $17,020 | $53,859 |
| 2014 | -- | $70,879 | $17,020 | $53,859 |
Source: Public Records
Map
Nearby Homes
- 5315 S 1950 W
- 5185 S 2100 W
- 5368 S 2200 W
- 5376 S 2200 W
- 5495 S 2100 W
- 5289 S 2200 W
- 5427 S 2200 W
- 5261 S 2200 W
- 5545 S 2100 W Unit D22
- 5243 S 2200 W
- 2078 W 5600 S
- 5547 S 2150 W
- 2182 W 5600 S Unit 16
- 2146 W 5600 S Unit 29
- 2113 W 5650 S
- 5468 S 2375 W
- 1779 W 5125 S
- 2144 W 5700 S
- 2318 W 5600 S
- 5643 S 2200 W
Your Personal Tour Guide
Ask me questions while you tour the home.