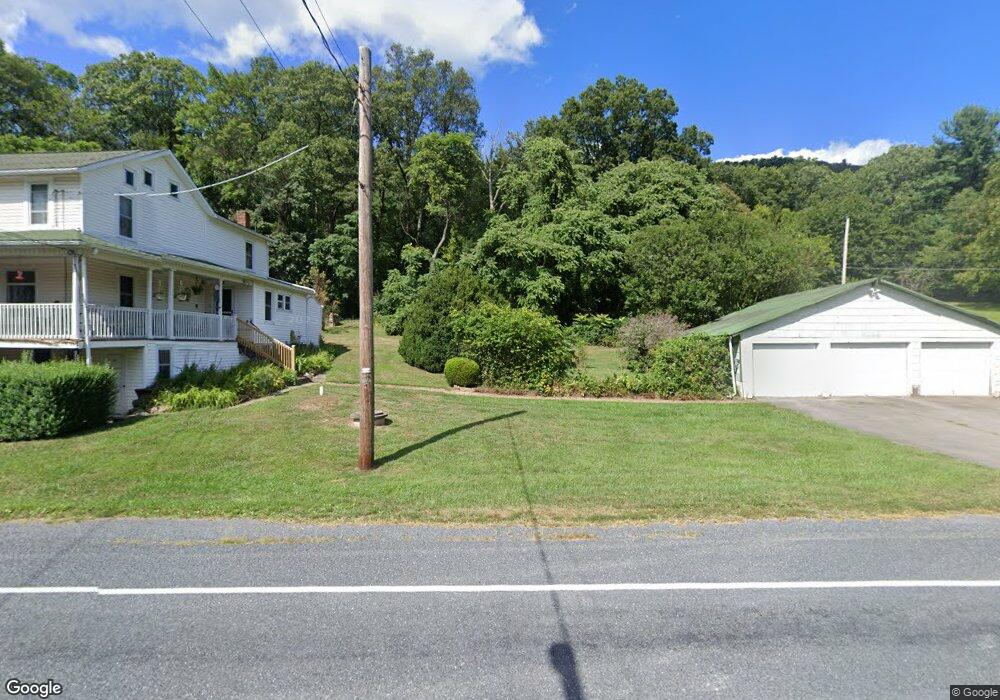
5343 Upper Rd Shamokin, PA 17872
Estimated Value: $95,317 - $266,000
Studio
--
Bath
--
Sq Ft
402,930
Sq Ft Lot
About This Home
This home is located at 5343 Upper Rd, Shamokin, PA 17872 and is currently estimated at $166,579. 5343 Upper Rd is a home located in Northumberland County with nearby schools including Shamokin Area Elementary School, Shamokin Area Middle School, and Shamokin Area High School.
Ownership History
Date
Name
Owned For
Owner Type
Purchase Details
Closed on
Jun 2, 2009
Sold by
Sawicki Frank J and Clausi Vinny
Bought by
Stoshack Christopher and Stoshack Jennifer R
Current Estimated Value
Home Financials for this Owner
Home Financials are based on the most recent Mortgage that was taken out on this home.
Original Mortgage
$168,522
Outstanding Balance
$107,048
Interest Rate
4.87%
Mortgage Type
New Conventional
Estimated Equity
$59,531
Purchase Details
Closed on
May 29, 2009
Sold by
Stoshack Christopher and Stoshack Jennifer R
Bought by
Stoshack Christopher M and Stoshack Jennifer R
Home Financials for this Owner
Home Financials are based on the most recent Mortgage that was taken out on this home.
Original Mortgage
$168,522
Outstanding Balance
$107,048
Interest Rate
4.87%
Mortgage Type
New Conventional
Estimated Equity
$59,531
Create a Home Valuation Report for This Property
The Home Valuation Report is an in-depth analysis detailing your home's value as well as a comparison with similar homes in the area
Purchase History
| Date | Buyer | Sale Price | Title Company |
|---|---|---|---|
| Stoshack Christopher | -- | None Available | |
| Stoshack Christopher M | -- | None Available |
Source: Public Records
Mortgage History
| Date | Status | Borrower | Loan Amount |
|---|---|---|---|
| Open | Stoshack Christopher M | $168,522 |
Source: Public Records
Tax History
| Year | Tax Paid | Tax Assessment Tax Assessment Total Assessment is a certain percentage of the fair market value that is determined by local assessors to be the total taxable value of land and additions on the property. | Land | Improvement |
|---|---|---|---|---|
| 2025 | $2,784 | $31,820 | $2,640 | $29,180 |
| 2024 | $2,526 | $31,820 | $2,640 | $29,180 |
| 2023 | $2,526 | $31,820 | $2,640 | $29,180 |
| 2022 | $2,466 | $31,820 | $2,640 | $29,180 |
| 2021 | $2,416 | $31,820 | $2,640 | $29,180 |
| 2020 | $2,374 | $31,820 | $2,640 | $29,180 |
| 2019 | $2,315 | $31,790 | $2,610 | $29,180 |
| 2018 | $2,278 | $31,790 | $2,610 | $29,180 |
| 2017 | $2,136 | $31,790 | $2,610 | $29,180 |
| 2016 | -- | $33,650 | $2,610 | $31,040 |
| 2015 | -- | $33,650 | $2,610 | $31,040 |
| 2014 | -- | $33,650 | $2,610 | $31,040 |
Source: Public Records
Map
Nearby Homes
- 4617 Upper Rd
- 4556 Upper Rd
- 0 Old Excelsior Rd
- 15 Snyder Rd
- 6852 Upper Rd
- 1674 Pulaski Ave
- 1705 Pulaski Ave
- 1701 Pulaski Ave
- 1542 Pulaski Ave
- 1665 Tioga St
- 456 S Shamokin St
- 400 and 402 S Shamokin St
- 1227 Pulaski Ave
- 328 S Shamokin St
- 1221 Chemung St
- 924 Hemlock St
- 303 S Rock St
- 1127 Pulaski Ave
- 213 S Franklin St
- 206 S Shamokin St
Your Personal Tour Guide
Ask me questions while you tour the home.