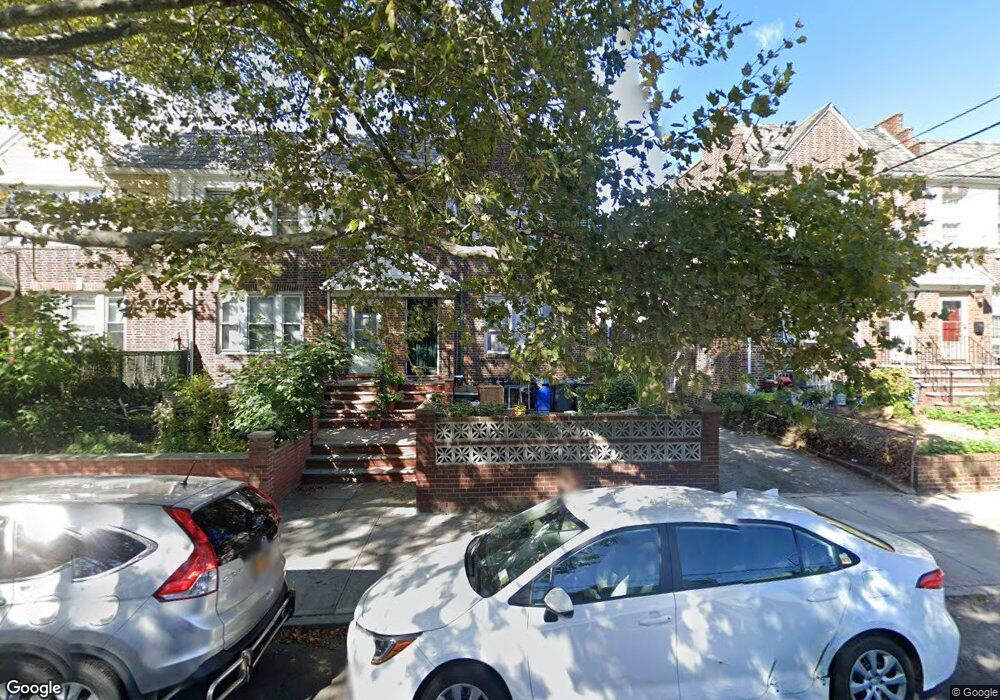
5344 65th Place Maspeth, NY 11378
Maspeth NeighborhoodEstimated Value: $1,063,338 - $1,299,000
--
Bed
--
Bath
2,500
Sq Ft
$489/Sq Ft
Est. Value
About This Home
This home is located at 5344 65th Place, Maspeth, NY 11378 and is currently estimated at $1,222,335, approximately $488 per square foot. 5344 65th Place is a home located in Queens County with nearby schools including P.S. 229 Emanuel Kaplan, IS 73 - The Frank Sansivieri School, and Grover Cleveland High School.
Ownership History
Date
Name
Owned For
Owner Type
Purchase Details
Closed on
Oct 17, 2011
Sold by
Quinlan David B and Quinlan Susan
Bought by
Pan Min Qin
Current Estimated Value
Home Financials for this Owner
Home Financials are based on the most recent Mortgage that was taken out on this home.
Original Mortgage
$428,400
Outstanding Balance
$291,903
Interest Rate
4.08%
Mortgage Type
Purchase Money Mortgage
Estimated Equity
$930,432
Purchase Details
Closed on
Dec 12, 2002
Sold by
Nicolaides Christine
Bought by
Quinlan David and Quinlan Susan
Purchase Details
Closed on
Sep 9, 1994
Sold by
Nicolaides Nicos and Nicolaides Stavroula
Bought by
Nicolaides Christina
Home Financials for this Owner
Home Financials are based on the most recent Mortgage that was taken out on this home.
Original Mortgage
$172,000
Interest Rate
8.43%
Create a Home Valuation Report for This Property
The Home Valuation Report is an in-depth analysis detailing your home's value as well as a comparison with similar homes in the area
Home Values in the Area
Average Home Value in this Area
Purchase History
| Date | Buyer | Sale Price | Title Company |
|---|---|---|---|
| Pan Min Qin | $612,000 | -- | |
| Pan Min Qin | $612,000 | -- | |
| Quinlan David | $520,000 | -- | |
| Quinlan David | $520,000 | -- | |
| Nicolaides Christina | -- | -- | |
| Nicolaides Christina | -- | -- |
Source: Public Records
Mortgage History
| Date | Status | Borrower | Loan Amount |
|---|---|---|---|
| Open | Pan Min Qin | $428,400 | |
| Closed | Pan Min Qin | $428,400 | |
| Previous Owner | Nicolaides Christina | $172,000 | |
| Closed | Quinlan David | $0 |
Source: Public Records
Tax History Compared to Growth
Tax History
| Year | Tax Paid | Tax Assessment Tax Assessment Total Assessment is a certain percentage of the fair market value that is determined by local assessors to be the total taxable value of land and additions on the property. | Land | Improvement |
|---|---|---|---|---|
| 2025 | $10,075 | $53,171 | $6,965 | $46,206 |
| 2024 | $10,075 | $50,164 | $7,283 | $42,881 |
| 2023 | $9,795 | $48,769 | $6,378 | $42,391 |
| 2022 | $9,736 | $64,380 | $9,660 | $54,720 |
| 2021 | $9,782 | $64,080 | $9,660 | $54,420 |
| 2020 | $9,369 | $62,340 | $9,660 | $52,680 |
| 2019 | $8,745 | $63,420 | $9,660 | $53,760 |
| 2018 | $8,285 | $40,641 | $7,635 | $33,006 |
| 2017 | $8,285 | $40,641 | $7,278 | $33,363 |
| 2016 | $7,744 | $40,641 | $7,278 | $33,363 |
| 2015 | $4,624 | $36,924 | $8,430 | $28,494 |
| 2014 | $4,624 | $34,836 | $9,549 | $25,287 |
Source: Public Records
Map
Nearby Homes
- 53-36 66th St
- 53-24 66th St
- 5307 65th Place
- 52-60 65th Place Unit 5E
- 62-15 53rd Ave Unit LGD
- 53-67 62nd St
- 5428 65th Place
- 52-24 65th Place Unit 3K
- 52-21 65th Place Unit 6P
- 5224 66th St
- 5221 65th Place Unit 6N
- 53-26 61st St
- 52-15 65th Place Unit 3A
- 52-15 65th Place Unit 2A
- 68-02 Jay Ave
- 6319 Borden Ave
- 5405 68th St
- 67-29 52nd Rd
- 6619 Clinton Ave
- 6731 52nd Rd
- 5346 65th Place
- 5340 65th Place
- 53-40 65th Place Unit 1
- 53-40 65th Place Unit 2
- 53-40 65th Place
- 5348 65th Place
- 5338 65th Place
- 5350 65th Place
- 53-36 65th Place
- 53-50 65th Place
- 53-50 65th Place Unit 2FL
- 53-50 65th Place Unit 1FL
- 5336 65th Place
- 53-38 65th Place
- 5352 65th Place
- 53-52 65th Place
- 5334 65th Place
- 5345 64th St
- 5347 64th St
- 5343 64th St