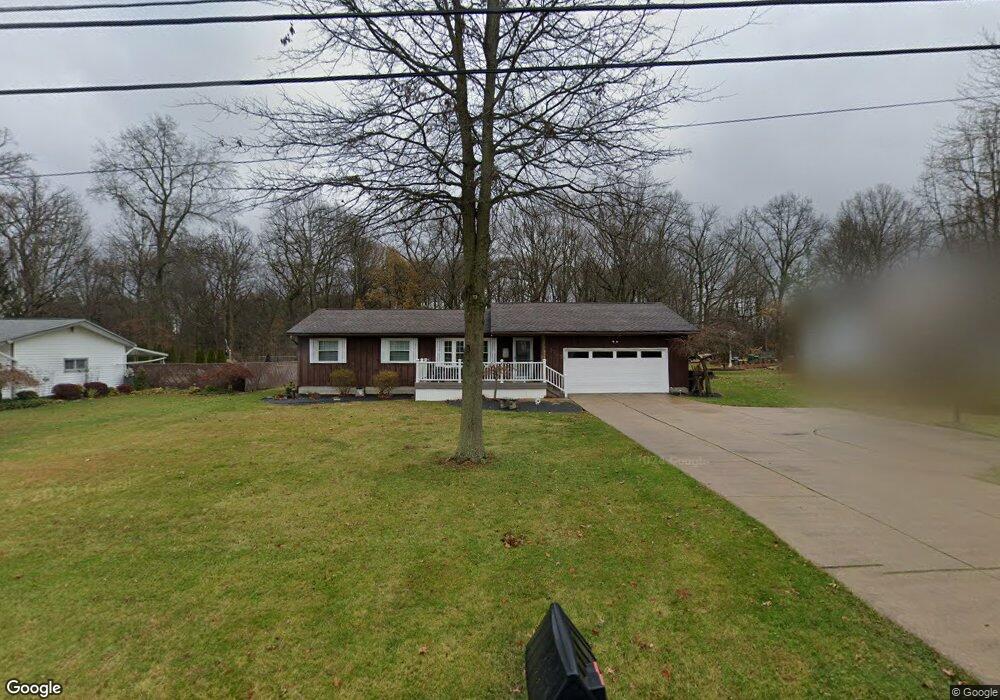
5345 Donner Dr Clinton, OH 44216
Estimated Value: $227,698 - $261,000
3
Beds
2
Baths
1,330
Sq Ft
$185/Sq Ft
Est. Value
About This Home
This home is located at 5345 Donner Dr, Clinton, OH 44216 and is currently estimated at $246,425, approximately $185 per square foot. 5345 Donner Dr is a home located in Summit County with nearby schools including Nolley Elementary School, Manchester Middle School, and Manchester High School.
Ownership History
Date
Name
Owned For
Owner Type
Purchase Details
Closed on
Feb 26, 2018
Sold by
Bickett Sandra
Bought by
Calvert Laura A
Current Estimated Value
Home Financials for this Owner
Home Financials are based on the most recent Mortgage that was taken out on this home.
Original Mortgage
$126,600
Outstanding Balance
$107,219
Interest Rate
3.99%
Mortgage Type
New Conventional
Estimated Equity
$139,206
Purchase Details
Closed on
Sep 17, 2014
Sold by
Mace Junior F
Bought by
Mace Junior F
Purchase Details
Closed on
Sep 16, 2014
Sold by
Dennison Rita M and Mace Rita M
Bought by
Mace Junior F
Purchase Details
Closed on
Feb 6, 2004
Sold by
Podnar Steven Thomas and Podnar Jennifer
Bought by
Mace Junior F and Dennison Rita M
Home Financials for this Owner
Home Financials are based on the most recent Mortgage that was taken out on this home.
Original Mortgage
$30,000
Interest Rate
3.62%
Mortgage Type
Purchase Money Mortgage
Create a Home Valuation Report for This Property
The Home Valuation Report is an in-depth analysis detailing your home's value as well as a comparison with similar homes in the area
Home Values in the Area
Average Home Value in this Area
Purchase History
| Date | Buyer | Sale Price | Title Company |
|---|---|---|---|
| Calvert Laura A | $135,000 | American Land Title | |
| Mace Junior F | -- | -- | |
| Mace Junior F | -- | -- | |
| Mace Junior F | $140,000 | Miller Examining Service Inc |
Source: Public Records
Mortgage History
| Date | Status | Borrower | Loan Amount |
|---|---|---|---|
| Open | Calvert Laura A | $126,600 | |
| Previous Owner | Mace Junior F | $30,000 |
Source: Public Records
Tax History
| Year | Tax Paid | Tax Assessment Tax Assessment Total Assessment is a certain percentage of the fair market value that is determined by local assessors to be the total taxable value of land and additions on the property. | Land | Improvement |
|---|---|---|---|---|
| 2024 | $3,275 | $65,545 | $10,966 | $54,579 |
| 2023 | $3,275 | $65,545 | $10,966 | $54,579 |
| 2022 | $3,449 | $53,809 | $9,373 | $44,436 |
| 2021 | $3,461 | $53,809 | $9,373 | $44,436 |
| 2020 | $3,401 | $53,810 | $9,370 | $44,440 |
| 2019 | $3,237 | $45,890 | $8,900 | $36,990 |
| 2018 | $2,863 | $45,890 | $8,900 | $36,990 |
| 2017 | $2,009 | $45,890 | $8,900 | $36,990 |
| 2016 | $1,985 | $38,630 | $8,900 | $29,730 |
| 2015 | $2,009 | $38,630 | $8,900 | $29,730 |
| 2014 | $1,994 | $38,630 | $8,900 | $29,730 |
| 2013 | $1,985 | $38,640 | $8,900 | $29,740 |
Source: Public Records
Map
Nearby Homes
- 1162 Tait Rd
- 1365 Vanderhoof Rd
- 5743 Brookwood Dr
- 5429 Grove Rd
- 4698 Manchester Rd
- 715 Highland Park Dr
- 771 Leeman Dr
- 477 Deborah Dr
- 427 Catalina Dr
- 6090 Manchester Rd Unit 6096
- 4567 Rex Lake Dr
- 5042 Laddie Dr
- 6235 Manchester Rd
- 4628 Whyem Dr
- lot 8 Whyem Dr
- 5766 Weaver Rd
- 4145 Manchester Rd
- 4387 Point Comfort Dr
- 7 Shrakes Hotel Dr
- 4216 State Rd
- 5355 Donner Dr
- 5335 Donner Dr
- 5396 Donner Dr
- 5321 Donner Dr
- 5346 Donner Dr
- 5369 Donner Dr
- 5336 Donner Dr
- 5356 Donner Dr
- 5326 Donner Dr
- 5366 Donner Dr
- 5316 Donner Dr
- 5376 Donner Dr
- 5391 Donner Dr
- 1284 Johns Rd
- 1264 Johns Rd
- 1302 Johns Rd
- 5386 Donner Dr
- 1318 Johns Rd
- 1354 Johns Rd Unit 1358
- 1328 Johns Rd
Your Personal Tour Guide
Ask me questions while you tour the home.