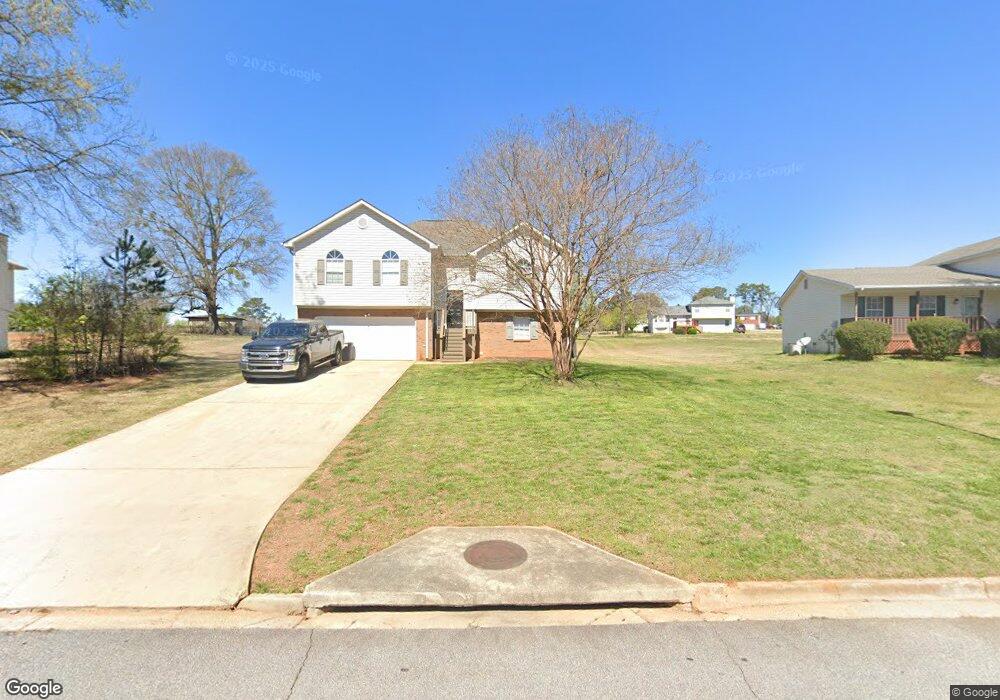
5345 Reuben Ct Ellenwood, GA 30294
Estimated Value: $295,680 - $336,000
4
Beds
3
Baths
2,300
Sq Ft
$133/Sq Ft
Est. Value
About This Home
This home is located at 5345 Reuben Ct, Ellenwood, GA 30294 and is currently estimated at $306,670, approximately $133 per square foot. 5345 Reuben Ct is a home located in Clayton County with nearby schools including East Clayton Elementary School, Adamson Middle School, and Morrow High School.
Ownership History
Date
Name
Owned For
Owner Type
Purchase Details
Closed on
Nov 6, 2024
Sold by
Armm Asset Co 2 Llc
Bought by
Armm Assets 2 Llc
Current Estimated Value
Purchase Details
Closed on
Jan 5, 2024
Sold by
Legacy Of Tuskegee Llc
Bought by
Armm Asset Co 2 Llc
Purchase Details
Closed on
Nov 2, 2023
Sold by
Iverson Patrick
Bought by
Legacy Of Tuskegee Llc
Purchase Details
Closed on
Apr 26, 2022
Sold by
Barnard Sandra Mae
Bought by
Iverson Patrick
Purchase Details
Closed on
May 21, 2002
Sold by
Reeves Michael M
Bought by
Bernard Sandra M
Purchase Details
Closed on
Sep 22, 1999
Sold by
Wall & Associates Inc
Bought by
Reeves Michael M
Home Financials for this Owner
Home Financials are based on the most recent Mortgage that was taken out on this home.
Original Mortgage
$130,050
Interest Rate
7.79%
Mortgage Type
New Conventional
Create a Home Valuation Report for This Property
The Home Valuation Report is an in-depth analysis detailing your home's value as well as a comparison with similar homes in the area
Home Values in the Area
Average Home Value in this Area
Purchase History
| Date | Buyer | Sale Price | Title Company |
|---|---|---|---|
| Armm Assets 2 Llc | $10,040,800 | -- | |
| Armm Asset Co 2 Llc | $235,000 | -- | |
| Wanjau Festus | $265,656 | -- | |
| Legacy Of Tuskegee Llc | $208,000 | -- | |
| Iverson Patrick | -- | -- | |
| Bernard Sandra M | -- | -- | |
| Reeves Michael M | $136,900 | -- | |
| Wall & Associates Inc | -- | -- |
Source: Public Records
Mortgage History
| Date | Status | Borrower | Loan Amount |
|---|---|---|---|
| Previous Owner | Wall & Associates Inc | $130,050 |
Source: Public Records
Tax History Compared to Growth
Tax History
| Year | Tax Paid | Tax Assessment Tax Assessment Total Assessment is a certain percentage of the fair market value that is determined by local assessors to be the total taxable value of land and additions on the property. | Land | Improvement |
|---|---|---|---|---|
| 2024 | $3,908 | $102,280 | $9,600 | $92,680 |
| 2023 | $2,684 | $73,280 | $9,600 | $63,680 |
| 2022 | $2,831 | $71,160 | $9,600 | $61,560 |
| 2021 | $2,706 | $67,560 | $9,600 | $57,960 |
| 2020 | $2,439 | $60,037 | $9,600 | $50,437 |
| 2019 | $2,148 | $51,967 | $9,600 | $42,367 |
| 2018 | $1,923 | $46,422 | $9,600 | $36,822 |
| 2017 | $1,837 | $44,216 | $9,600 | $34,616 |
| 2016 | $1,852 | $44,588 | $9,600 | $34,988 |
| 2015 | $1,752 | $0 | $0 | $0 |
| 2014 | $1,738 | $42,754 | $9,600 | $33,154 |
Source: Public Records
Map
Nearby Homes
- 5284 Benjamin Trail
- 3719 Jackson Ln Unit 1
- 5514 Frontier Ct
- 3491 Saddle Creek Ln Unit 1
- 3485 Saddle Creek Ln Unit 1
- 3720 Laramie Rd
- 3595 Edies Way
- 3587 Arminto Dr
- 5513 Emily Cir
- 2064 Panola Rd
- 3689 Fremont Dr
- 5058 Saddle Creek Cir
- 3927 Villager Way
- 5748 Meadow Ln Unit 4
- 5578 Swanson Rd
- 3357 Bonnes Ct
- 245 Remington Trail
- 5810 Mistyview Dr Unit 3
- 3821 Rex Mill Square
- 5353 Reuben Ct
- 5337 Reuben Ct
- 5312 Queen Ester Ct
- 0 Sheba Dr Unit 3242802
- 0 Sheba Dr
- 5361 Reuben Ct
- 5304 Queen Ester Ct
- 5320 Queen Ester Ct
- 5356 Reuben Ct
- 5342 Reuben Ct
- 5336 Queen Ester Ct
- 5346 Queen Ester Ct
- 5354 Queen Ester Ct
- 5369 Reuben Ct
- 3696 Sheba Dr
- 3688 Sheba Dr
- 5368 Reuben Ct
- 3680 Sheba Dr
- 3706 Sheba Dr
- 5362 Queen Ester Ct