Estimated Value: $835,000 - $948,000
3
Beds
2
Baths
1,890
Sq Ft
$465/Sq Ft
Est. Value
About This Home
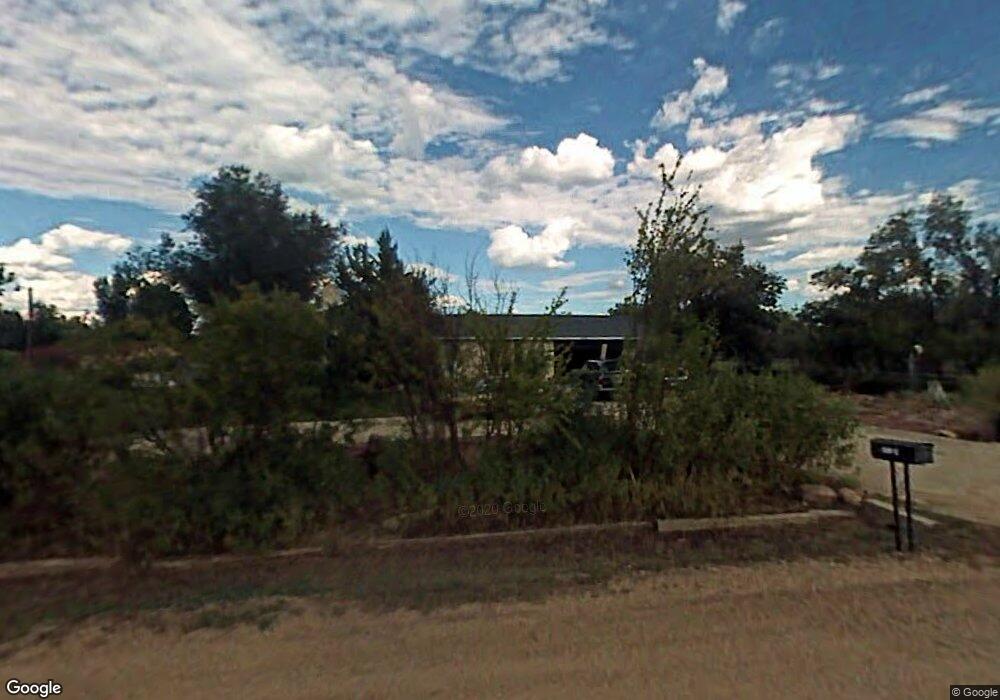
This home is located at 5346 Fir Ave, Erie, CO 80516 and is currently estimated at $879,581, approximately $465 per square foot. 5346 Fir Ave is a home located in Weld County with nearby schools including Erie Elementary School, Erie Middle School, and Erie High School.
Ownership History
Date
Name
Owned For
Owner Type
Purchase Details
Closed on
Oct 3, 2012
Sold by
Prine Dean J
Bought by
Prine Dean J and Beckvermit Prine Kelli L
Current Estimated Value
Purchase Details
Closed on
Oct 28, 2010
Sold by
Prine Dixie L
Bought by
Prine Dean J
Home Financials for this Owner
Home Financials are based on the most recent Mortgage that was taken out on this home.
Original Mortgage
$284,170
Outstanding Balance
$182,632
Interest Rate
3.92%
Mortgage Type
New Conventional
Estimated Equity
$696,949
Purchase Details
Closed on
Feb 16, 2007
Sold by
Chavez Carmen V
Bought by
Prine Dean and Prine Dixie
Home Financials for this Owner
Home Financials are based on the most recent Mortgage that was taken out on this home.
Original Mortgage
$284,000
Interest Rate
6.13%
Mortgage Type
Unknown
Purchase Details
Closed on
Jun 10, 1976
Create a Home Valuation Report for This Property
The Home Valuation Report is an in-depth analysis detailing your home's value as well as a comparison with similar homes in the area
Home Values in the Area
Average Home Value in this Area
Purchase History
| Date | Buyer | Sale Price | Title Company |
|---|---|---|---|
| Prine Dean J | -- | None Available | |
| Prine Dean J | -- | Guardian Title | |
| Prine Dean | $302,500 | None Available | |
| -- | -- | -- |
Source: Public Records
Mortgage History
| Date | Status | Borrower | Loan Amount |
|---|---|---|---|
| Open | Prine Dean J | $284,170 | |
| Closed | Prine Dean | $284,000 |
Source: Public Records
Tax History Compared to Growth
Tax History
| Year | Tax Paid | Tax Assessment Tax Assessment Total Assessment is a certain percentage of the fair market value that is determined by local assessors to be the total taxable value of land and additions on the property. | Land | Improvement |
|---|---|---|---|---|
| 2025 | $4,514 | $53,530 | $17,010 | $36,520 |
| 2024 | $4,514 | $53,530 | $17,010 | $36,520 |
| 2023 | $4,328 | $52,440 | $18,410 | $34,030 |
| 2022 | $3,666 | $39,060 | $13,380 | $25,680 |
| 2021 | $3,731 | $40,190 | $13,770 | $26,420 |
| 2020 | $3,322 | $36,100 | $13,120 | $22,980 |
| 2019 | $3,360 | $36,100 | $13,120 | $22,980 |
| 2018 | $3,058 | $33,270 | $6,120 | $27,150 |
| 2017 | $2,827 | $32,050 | $6,120 | $25,930 |
| 2016 | $2,421 | $27,270 | $5,970 | $21,300 |
| 2015 | $2,190 | $25,540 | $5,970 | $19,570 |
| 2014 | $1,876 | $21,950 | $5,970 | $15,980 |
Source: Public Records
Map
Nearby Homes
- 4764 Beverly Ln
- 2344 County Road 12
- 4738 County Road 5
- 270 Maddox Ln
- 1820 Metcalf Ct
- 6021 Sandstone Cir
- 6009 Caribou Ct
- 1809 Meagan Way
- 6041 Sandstone Cir
- 6045 Sandstone Cir
- 1928 Marlowe Cir W
- 1963 Merrill Dr
- 6244 Waterman Way
- 1924 Morgan Dr
- 6109 Burdock Ct Unit 103
- 6101 Summit Peak Ct Unit 105
- 1351 Yale Ave
- 6325 Saratoga Trail
- 6325 Ruby Hill Dr
- 2913 Saratoga Trail