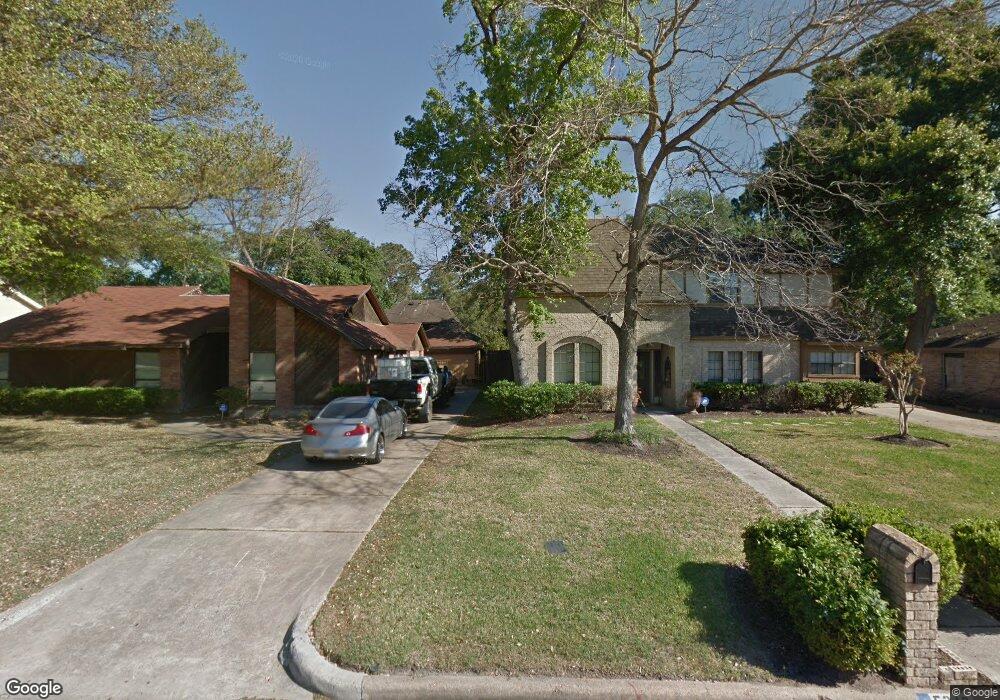
5346 Oak Cove Dr Houston, TX 77091
Greater Inwood NeighborhoodEstimated Value: $278,421 - $325,000
3
Beds
2
Baths
2,090
Sq Ft
$146/Sq Ft
Est. Value
About This Home
This home is located at 5346 Oak Cove Dr, Houston, TX 77091 and is currently estimated at $305,355, approximately $146 per square foot. 5346 Oak Cove Dr is a home located in Harris County with nearby schools including Edward a Vines EC/Pre-K/K School, J. Ruth Smith Elementary, and Hoffman Middle School.
Ownership History
Date
Name
Owned For
Owner Type
Purchase Details
Closed on
Apr 11, 2013
Sold by
Davis Monica
Bought by
Davis Deric
Current Estimated Value
Purchase Details
Closed on
Nov 20, 2003
Sold by
Mcgowan Robert Joseph and Mcgowan Cheryl
Bought by
Davis Deric and Davis Monica
Home Financials for this Owner
Home Financials are based on the most recent Mortgage that was taken out on this home.
Original Mortgage
$104,362
Interest Rate
5.93%
Mortgage Type
FHA
Purchase Details
Closed on
May 22, 1997
Sold by
Mcgowan Randel Williams
Bought by
Mcgowan Robert
Purchase Details
Closed on
Apr 26, 1994
Sold by
Barron Floyd Lawrence and Barron Sylvia Janine
Bought by
Mcgowan Robert J and Mcgowan Marilyn
Purchase Details
Closed on
Apr 2, 1994
Sold by
Mcgowan Patrick P
Bought by
Mcgowan R J
Create a Home Valuation Report for This Property
The Home Valuation Report is an in-depth analysis detailing your home's value as well as a comparison with similar homes in the area
Home Values in the Area
Average Home Value in this Area
Purchase History
| Date | Buyer | Sale Price | Title Company |
|---|---|---|---|
| Davis Deric | -- | None Available | |
| Davis Deric | -- | Fidelity National Title | |
| Mcgowan Robert | -- | American Title Company | |
| Mcgowan Robert J | -- | Fidelity National Title | |
| Mcgowan R J | -- | -- |
Source: Public Records
Mortgage History
| Date | Status | Borrower | Loan Amount |
|---|---|---|---|
| Previous Owner | Davis Deric | $104,362 |
Source: Public Records
Tax History Compared to Growth
Tax History
| Year | Tax Paid | Tax Assessment Tax Assessment Total Assessment is a certain percentage of the fair market value that is determined by local assessors to be the total taxable value of land and additions on the property. | Land | Improvement |
|---|---|---|---|---|
| 2025 | $3,426 | $216,558 | $54,600 | $161,958 |
| 2024 | $3,426 | $221,033 | $54,600 | $166,433 |
| 2023 | $3,426 | $248,698 | $54,600 | $194,098 |
| 2022 | $4,344 | $210,698 | $26,334 | $184,364 |
| 2021 | $4,136 | $173,900 | $26,334 | $147,566 |
| 2020 | $3,951 | $176,384 | $26,334 | $150,050 |
| 2019 | $3,765 | $147,239 | $25,780 | $121,459 |
| 2018 | $1,339 | $131,110 | $27,720 | $103,390 |
| 2017 | $3,691 | $141,700 | $27,720 | $113,980 |
| 2016 | $3,356 | $148,421 | $27,720 | $120,701 |
| 2015 | $1,176 | $132,149 | $24,360 | $107,789 |
| 2014 | $1,176 | $129,706 | $24,360 | $105,346 |
Source: Public Records
Map
Nearby Homes
- 6215 Ash Oak Dr
- 5322 Winding Way Dr
- 6203 Oak Bay Dr
- 5434 Sheraton Oaks Dr
- 5418 Winding Way Dr
- 6514 Bayou View Dr
- 6609 Bayou View Dr
- 5622 Sheraton Oaks Dr
- 3514 Areba St
- 00 T C Jester
- 0000 T C Jester Blvd
- 5505 T C Jester Blvd
- 6413 T C Jester Blvd
- 0 T C Jester Blvd Unit 62962419
- 6430 Antoine Dr
- 3406 De Soto St
- 4906 Droddy St
- 6024 T C Jester Blvd
- 3422 Mansfield St
- 3414 Mansfield St
- 5350 Oak Cove Dr
- 5342 Oak Cove Dr
- 5339 Holly View Dr
- 5343 Holly View Dr
- 5402 Oak Cove Dr
- 5335 Holly View Dr
- 5338 Oak Cove Dr
- 5403 Holly View Dr
- 5331 Holly View Dr
- 5343 Oak Cove Dr
- 5347 Oak Cove Dr
- 5406 Oak Cove Dr
- 5339 Oak Cove Dr
- 5334 Oak Cove Dr
- 5403 Oak Cove Dr
- 5407 Holly View Dr
- 5327 Holly View Dr
- 5335 Oak Cove Dr
- 5347 Holly View Dr
- 5407 Oak Cove Dr