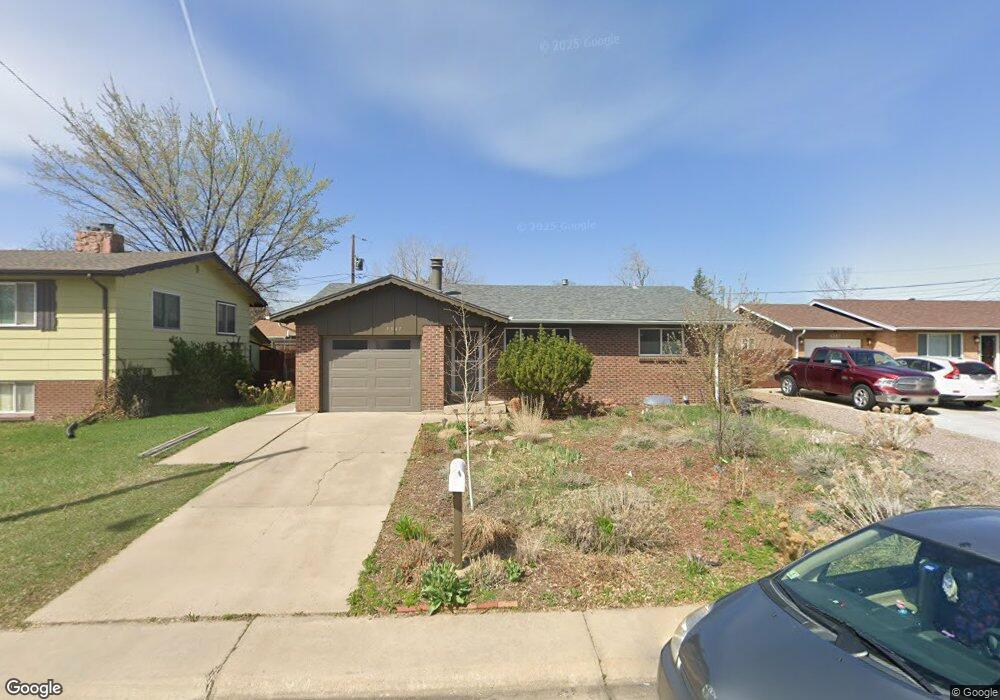
5347 Field Cir Arvada, CO 80002
Arvada Plaza Area NeighborhoodEstimated Value: $490,000 - $604,000
3
Beds
2
Baths
1,652
Sq Ft
$335/Sq Ft
Est. Value
About This Home
This home is located at 5347 Field Cir, Arvada, CO 80002 and is currently estimated at $553,994, approximately $335 per square foot. 5347 Field Cir is a home located in Jefferson County with nearby schools including Lawrence Elementary School, North Arvada Middle School, and Arvada High School.
Ownership History
Date
Name
Owned For
Owner Type
Purchase Details
Closed on
Dec 30, 2015
Sold by
Lapham David L and Lapham Catherine
Bought by
King Dave G and King Emily G
Current Estimated Value
Home Financials for this Owner
Home Financials are based on the most recent Mortgage that was taken out on this home.
Original Mortgage
$261,250
Outstanding Balance
$203,992
Interest Rate
3.98%
Mortgage Type
New Conventional
Estimated Equity
$350,002
Purchase Details
Closed on
Jun 11, 2010
Sold by
Albeck David Scott
Bought by
Lapham David L and Lapham Catherine
Home Financials for this Owner
Home Financials are based on the most recent Mortgage that was taken out on this home.
Original Mortgage
$116,156
Interest Rate
4.75%
Mortgage Type
FHA
Purchase Details
Closed on
Nov 8, 1994
Sold by
Albeck Richard H and Albeck Lois M
Bought by
Albeck David Scott
Create a Home Valuation Report for This Property
The Home Valuation Report is an in-depth analysis detailing your home's value as well as a comparison with similar homes in the area
Home Values in the Area
Average Home Value in this Area
Purchase History
We collect this data history from publicly available records. To have your information removed, we recommend requesting removal directly through your county’s website.
| Date | Buyer | Sale Price | Title Company |
|---|---|---|---|
| King Dave G | $275,000 | Land Title Guarantee Company | |
| Lapham David L | $153,600 | Land Title Guarantee Company | |
| Albeck David Scott | -- | -- |
Source: Public Records
Mortgage History
We collect this data history from publicly available records. To have your information removed, we recommend requesting removal directly through your county’s website.
| Date | Status | Borrower | Loan Amount |
|---|---|---|---|
| Open | King Dave G | $261,250 | |
| Previous Owner | Lapham David L | $116,156 |
Source: Public Records
Tax History
| Year | Tax Paid | Tax Assessment Tax Assessment Total Assessment is a certain percentage of the fair market value that is determined by local assessors to be the total taxable value of land and additions on the property. | Land | Improvement |
|---|---|---|---|---|
| 2025 | $3,305 | $32,053 | $13,273 | $18,780 |
| 2024 | $3,002 | $30,946 | $17,227 | $13,719 |
| 2023 | $3,002 | $30,946 | $17,227 | $13,719 |
| 2022 | $2,650 | $27,063 | $10,494 | $16,569 |
| 2021 | $2,694 | $27,842 | $10,796 | $17,046 |
| 2020 | $2,404 | $24,907 | $8,942 | $15,965 |
| 2019 | $2,371 | $24,907 | $8,942 | $15,965 |
| 2018 | $2,081 | $21,257 | $6,012 | $15,245 |
| 2017 | $1,905 | $21,257 | $6,012 | $15,245 |
| 2016 | $1,632 | $16,954 | $5,539 | $11,415 |
| 2015 | $1,412 | $16,954 | $5,539 | $11,415 |
| 2014 | $1,412 | $13,946 | $4,872 | $9,074 |
Source: Public Records
Map
Nearby Homes
- 5250 Garrison St Unit 9
- 9300 W 53rd Place
- 8967 W 54th Place
- 9309 Highland Place
- 9305 W 52nd Ave
- 9210 W 52nd Ave
- 5530 Holland Dr
- 8735 W 54th Place
- 5182 Estes Cir
- 9150 Grandview Ave
- 5126 Hoyt St
- 9565 W 52nd Ave
- 5592 Independence St
- 5211 Dover St
- 9570 W 54th Place
- 5555 Dudley Ct
- 9608 W 53rd Ave
- 5051 Garrison St Unit 7C
- 8620 W 52nd Ave
- 5140 Dover St
- 5349 Flower Cir
- 5339 Flower Cir
- 5359 Flower Cir
- 5372 Garrison St
- 5362 Garrison St
- 5329 Flower Cir
- 5338 Flower Cir
- 5352 Garrison St
- 5348 Flower Cir
- 5358 Flower Cir
- 5328 Flower Cir
- 5319 Flower Cir
- 5313-5372 Field St 5373-202
- 5342 Garrison St
- 5318 Flower Cir
- 5357 Field Cir
- 9143 W 53rd Ave
- 5337 Garrison St
- 9173 W 53rd Ave
- 5327 Field Cir
Your Personal Tour Guide
Ask me questions while you tour the home.