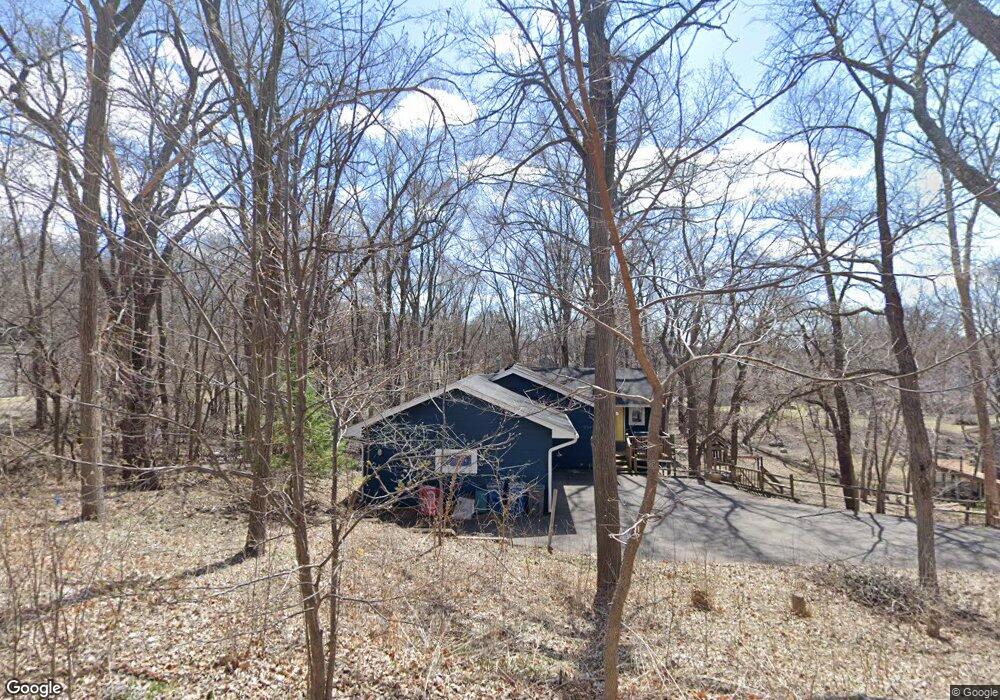
5347 Mayview Rd Minnetonka, MN 55345
Estimated Value: $463,000 - $555,000
3
Beds
2
Baths
1,224
Sq Ft
$406/Sq Ft
Est. Value
About This Home
This home is located at 5347 Mayview Rd, Minnetonka, MN 55345 and is currently estimated at $497,417, approximately $406 per square foot. 5347 Mayview Rd is a home located in Hennepin County with nearby schools including Gatewood Elementary School, Hopkins West Junior High School, and Hopkins Senior High School.
Ownership History
Date
Name
Owned For
Owner Type
Purchase Details
Closed on
May 31, 2019
Sold by
Service Stacia and Service Spencer
Bought by
Reilly Amy
Current Estimated Value
Home Financials for this Owner
Home Financials are based on the most recent Mortgage that was taken out on this home.
Original Mortgage
$328,500
Outstanding Balance
$287,629
Interest Rate
4.1%
Mortgage Type
New Conventional
Estimated Equity
$209,788
Purchase Details
Closed on
Feb 28, 2017
Sold by
Stanoch David J and Tessman Katherine Annette
Bought by
Burtis Stacia and Service Spencer
Home Financials for this Owner
Home Financials are based on the most recent Mortgage that was taken out on this home.
Original Mortgage
$274,650
Interest Rate
4.09%
Mortgage Type
New Conventional
Purchase Details
Closed on
Apr 13, 1998
Sold by
Goulson David and Goulson Allison
Bought by
Tessman Katherine
Create a Home Valuation Report for This Property
The Home Valuation Report is an in-depth analysis detailing your home's value as well as a comparison with similar homes in the area
Purchase History
We collect this data history from publicly available records. To have your information removed, we recommend requesting removal directly through your county’s website.
| Date | Buyer | Sale Price | Title Company |
|---|---|---|---|
| Reilly Amy | $365,000 | Global Closing & Title Svcs | |
| Burtis Stacia | $1,839,868 | Burnet Title | |
| Tessman Katherine | $136,500 | -- |
Source: Public Records
Mortgage History
We collect this data history from publicly available records. To have your information removed, we recommend requesting removal directly through your county’s website.
| Date | Status | Borrower | Loan Amount |
|---|---|---|---|
| Open | Reilly Amy | $328,500 | |
| Previous Owner | Burtis Stacia | $274,650 |
Source: Public Records
Tax History
| Year | Tax Paid | Tax Assessment Tax Assessment Total Assessment is a certain percentage of the fair market value that is determined by local assessors to be the total taxable value of land and additions on the property. | Land | Improvement |
|---|---|---|---|---|
| 2024 | $5,593 | $460,700 | $213,400 | $247,300 |
| 2023 | $5,414 | $458,500 | $213,400 | $245,100 |
| 2022 | $4,629 | $430,700 | $213,400 | $217,300 |
| 2021 | $4,317 | $372,200 | $194,000 | $178,200 |
| 2020 | $4,312 | $353,100 | $194,000 | $159,100 |
| 2019 | $4,104 | $335,700 | $194,000 | $141,700 |
| 2018 | $3,782 | $323,500 | $194,000 | $129,500 |
| 2017 | $3,668 | $279,300 | $175,000 | $104,300 |
| 2016 | $3,843 | $283,600 | $165,000 | $118,600 |
| 2015 | $3,519 | $256,800 | $150,000 | $106,800 |
| 2014 | -- | $248,200 | $150,000 | $98,200 |
Source: Public Records
Map
Nearby Homes
- 5517 Dickson Rd
- 5131 Baker Rd
- 5542 Rowland Rd
- 13001 Maywood Ln
- 14401 Atrium Way Unit 136
- 14501 Atrium Way Unit 225
- 4860 Woodridge Ct
- 5479 Maple Ridge Ct
- 5434 Williston Rd
- 5498 Maple Ridge Ct
- 13200 Excelsior Blvd
- 14819 Cherry Ln
- 14705 Glendale Rd
- 5038 Dominick Spur
- 14709 Glendale Rd
- 15074 Highland Trail
- 15125 Glen Oak St
- 4760 Dominick Dr
- 4755 Dominick Dr
- 6342 Saint Johns Dr
- 13601 North St
- 5349 Mayview Rd
- 5346 Mayview Rd
- 13531 North St
- 5453 Mayview Rd
- 5345 Mayview Rd
- 5352 Mayview Rd
- 5429 Mayview Rd
- 5457 Mayview Rd
- 13521 North St
- 13520 North St
- 5433 Mayview Rd
- 5336 Mayview Rd
- 5442 Mayview Rd
- 5356 Mayview Rd
- 13511 North St
- 5333 Mayview Rd
- 5501 Mayview Rd
- 5436 Mayview Rd
- 13509 North St
Your Personal Tour Guide
Ask me questions while you tour the home.