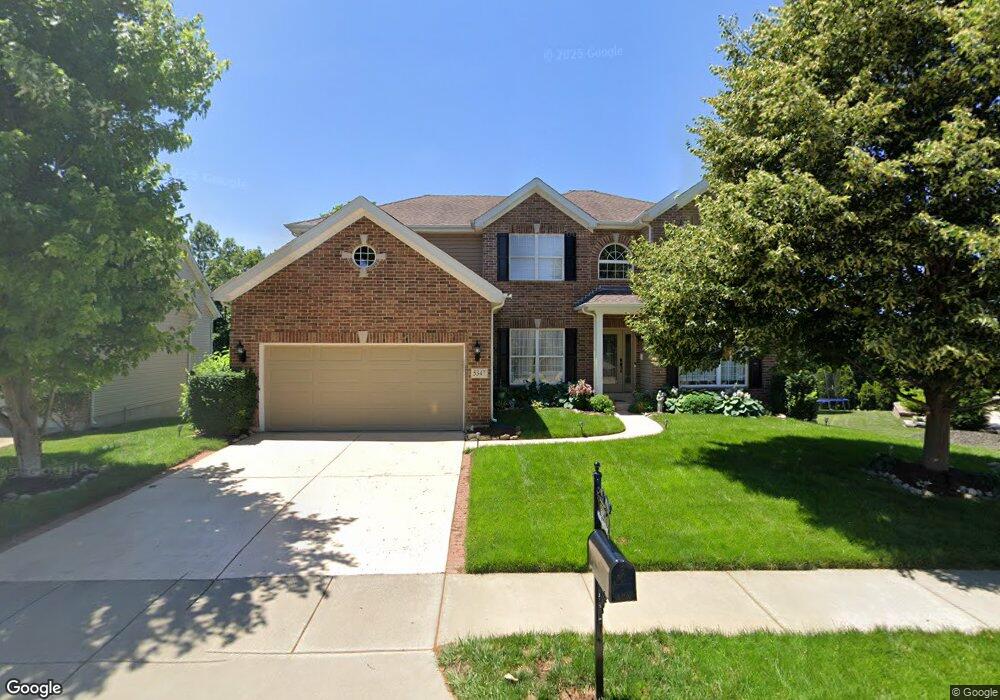
5347 Mirasol Manor Way Eureka, MO 63025
Estimated Value: $427,000 - $555,000
4
Beds
3
Baths
1,620
Sq Ft
$294/Sq Ft
Est. Value
About This Home
This home is located at 5347 Mirasol Manor Way, Eureka, MO 63025 and is currently estimated at $476,787, approximately $294 per square foot. 5347 Mirasol Manor Way is a home located in Jefferson County with nearby schools including Geggie Elementary School, Lasalle Springs Middle School, and Eureka Senior High School.
Ownership History
Date
Name
Owned For
Owner Type
Purchase Details
Closed on
Mar 22, 2010
Sold by
State Farm Bank Fsb
Bought by
Santoro Mark and Santoro Cheryl
Current Estimated Value
Home Financials for this Owner
Home Financials are based on the most recent Mortgage that was taken out on this home.
Original Mortgage
$260,200
Outstanding Balance
$171,505
Interest Rate
4.87%
Mortgage Type
FHA
Estimated Equity
$305,282
Purchase Details
Closed on
Nov 3, 2009
Sold by
Trower Megan
Bought by
State Farm Bank Fsb
Purchase Details
Closed on
Jun 12, 2008
Sold by
Mcbride & Son Homes Inc
Bought by
Trower Matt and Trower Megan
Home Financials for this Owner
Home Financials are based on the most recent Mortgage that was taken out on this home.
Original Mortgage
$353,390
Interest Rate
6.05%
Mortgage Type
Purchase Money Mortgage
Create a Home Valuation Report for This Property
The Home Valuation Report is an in-depth analysis detailing your home's value as well as a comparison with similar homes in the area
Home Values in the Area
Average Home Value in this Area
Purchase History
| Date | Buyer | Sale Price | Title Company |
|---|---|---|---|
| Santoro Mark | -- | Integrity Land Title Co Inc | |
| State Farm Bank Fsb | $261,870 | None Available | |
| Trower Matt | -- | Dependable Title Llc |
Source: Public Records
Mortgage History
| Date | Status | Borrower | Loan Amount |
|---|---|---|---|
| Open | Santoro Mark | $260,200 | |
| Previous Owner | Trower Matt | $353,390 |
Source: Public Records
Tax History
| Year | Tax Paid | Tax Assessment Tax Assessment Total Assessment is a certain percentage of the fair market value that is determined by local assessors to be the total taxable value of land and additions on the property. | Land | Improvement |
|---|---|---|---|---|
| 2025 | $4,844 | $76,300 | $10,700 | $65,600 |
| 2024 | $4,844 | $67,400 | $8,800 | $58,600 |
| 2023 | $4,844 | $67,400 | $8,800 | $58,600 |
| 2022 | $5,144 | $67,400 | $8,800 | $58,600 |
| 2021 | $5,106 | $67,400 | $8,800 | $58,600 |
| 2020 | $4,674 | $59,100 | $8,000 | $51,100 |
| 2019 | $4,702 | $59,100 | $8,000 | $51,100 |
| 2018 | $4,920 | $59,100 | $8,000 | $51,100 |
| 2017 | $4,529 | $59,100 | $8,000 | $51,100 |
| 2016 | $4,373 | $55,400 | $8,000 | $47,400 |
| 2015 | $4,356 | $55,400 | $8,000 | $47,400 |
| 2013 | $4,356 | $54,900 | $8,000 | $46,900 |
Source: Public Records
Map
Nearby Homes
- 5563 Mirasol Manor Way
- 5556 Mirasol Manor Way
- 2449 Flowerdale Ct
- 1675 Ridgefield Bluff Ct
- 2 Nottingham at Windswept Farms
- 1142 Bloomfield Dr
- 22 Fall Flower Ct
- 2 Sequoia at Windswept Farms
- 1154 Bloomfield Dr
- 2 Hermitage II at Windswept Farm
- 1049 Bloomfield Dr
- 2179 Windswept Farms Dr
- 9 N Trail Dr
- 1045 Bloomfield Dr
- 1416 Bloomfield Dr
- 2 Pin Oak at Windswept Farms
- 2 Maple Expanded at Windswept
- 1412 Bloomfield Dr
- 2 Hickory at Windswept Farms
- 2449 Chukka Dr
- 5351 Mirasol Manor Way
- 5351Lot #233 Mirasol Manor Way
- 5351 Mirasol Manor Lot #233 Way
- 2400 Mirasol Trail
- 5355 Mirasol Manor Way
- 2404 Mirasol Trail
- 5346 Mirasol Manor Way
- 5350 Mirasol Manor Way
- 5359 Mirasol Manor Way
- 2408 Mirasol Trail
- 5358 Mirasol Manor Way
- 5342 Mirasol Manor Way
- 5363 Mirasol Manor Way
- 2401 Mirasol Trail
- 5362 Mirasol Manor Way
- 5362Lot #143 Mirasol Manor Way
- 2412 Mirasol Trail
- 5495 Mirasol Manor Way
- 5491 Mirasol Manor Way
- 2407 Mirasol Trail
Your Personal Tour Guide
Ask me questions while you tour the home.