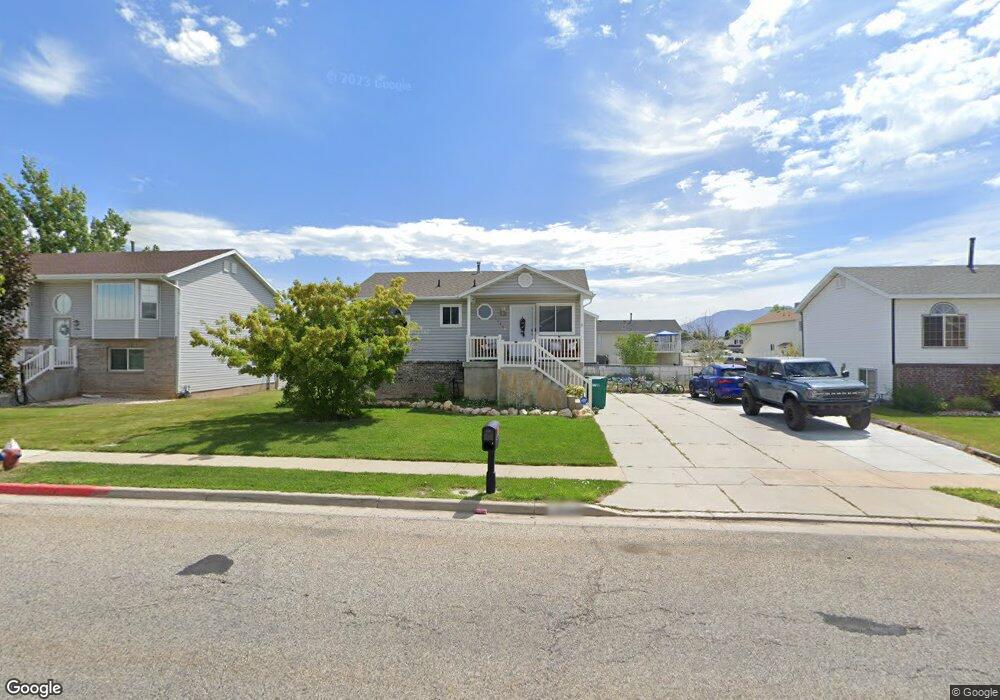
5348 S 4300 W Hooper, UT 84315
Estimated Value: $384,000 - $418,000
3
Beds
1
Bath
780
Sq Ft
$518/Sq Ft
Est. Value
About This Home
This home is located at 5348 S 4300 W, Hooper, UT 84315 and is currently estimated at $403,872, approximately $517 per square foot. 5348 S 4300 W is a home located in Weber County with nearby schools including Country View School, Rocky Mountain Junior High School, and Bridge Elementary School.
Ownership History
Date
Name
Owned For
Owner Type
Purchase Details
Closed on
Aug 15, 2025
Sold by
Bickley Family Trust and Linam Meladie
Bought by
Linam Meladie Joy
Current Estimated Value
Home Financials for this Owner
Home Financials are based on the most recent Mortgage that was taken out on this home.
Original Mortgage
$280,000
Outstanding Balance
$279,758
Interest Rate
6.72%
Mortgage Type
New Conventional
Estimated Equity
$124,114
Purchase Details
Closed on
Jun 12, 2025
Sold by
Arnell Jack Eric
Bought by
Bickley Family Trust and Linam
Purchase Details
Closed on
Dec 3, 2014
Sold by
Gorder Joshua Evan and Gorder Nicole Schmidt
Bought by
Arnell Jack
Home Financials for this Owner
Home Financials are based on the most recent Mortgage that was taken out on this home.
Original Mortgage
$140,505
Interest Rate
3.89%
Mortgage Type
New Conventional
Purchase Details
Closed on
Apr 2, 2010
Sold by
Nate Mueller Pc
Bought by
Gorder Joshua Evan and Gorder Nicole Schmidt
Purchase Details
Closed on
Jan 14, 2008
Sold by
Seegmiller Melissa
Bought by
Lemieux Joseph Brian and Seegmiller Melissa
Home Financials for this Owner
Home Financials are based on the most recent Mortgage that was taken out on this home.
Original Mortgage
$127,400
Interest Rate
5.96%
Mortgage Type
New Conventional
Purchase Details
Closed on
Jun 13, 2002
Sold by
Hud
Bought by
Smith Ryan R and Smith Alison D
Home Financials for this Owner
Home Financials are based on the most recent Mortgage that was taken out on this home.
Original Mortgage
$98,455
Interest Rate
6.86%
Mortgage Type
FHA
Purchase Details
Closed on
Jan 18, 2002
Sold by
North American Mtg Company
Bought by
Hud
Purchase Details
Closed on
Jan 8, 2002
Sold by
Brunson Joshua R and Brunson Angie B
Bought by
North American Mtg Company
Purchase Details
Closed on
Jul 17, 2000
Sold by
Craker Brett and Craker Kathleen
Bought by
Brunson Joshua R and Brunson Angie B
Home Financials for this Owner
Home Financials are based on the most recent Mortgage that was taken out on this home.
Original Mortgage
$106,621
Interest Rate
8.37%
Purchase Details
Closed on
Jan 12, 2000
Sold by
Washington Mutual Bank Fsb
Bought by
Craker Brett and Craker Kathleen
Home Financials for this Owner
Home Financials are based on the most recent Mortgage that was taken out on this home.
Original Mortgage
$84,268
Interest Rate
7.83%
Mortgage Type
Seller Take Back
Purchase Details
Closed on
Sep 30, 1998
Sold by
Pierce Brandon P
Bought by
Washington Mutual Bank Fsb
Purchase Details
Closed on
Dec 24, 1996
Sold by
Baucorp Co
Bought by
Pierce Brandon P
Home Financials for this Owner
Home Financials are based on the most recent Mortgage that was taken out on this home.
Original Mortgage
$67,200
Interest Rate
10.25%
Create a Home Valuation Report for This Property
The Home Valuation Report is an in-depth analysis detailing your home's value as well as a comparison with similar homes in the area
Home Values in the Area
Average Home Value in this Area
Purchase History
| Date | Buyer | Sale Price | Title Company |
|---|---|---|---|
| Linam Meladie Joy | -- | Prospect Title | |
| Bickley Family Trust | -- | None Listed On Document | |
| Arnell Jack | -- | First American | |
| Gorder Joshua Evan | -- | Utah Commercial Title | |
| Lemieux Joseph Brian | -- | Backman | |
| Smith Ryan R | -- | First American Title | |
| Hud | -- | First Southwestern Title | |
| North American Mtg Company | -- | Guardian Title Company | |
| Brunson Joshua R | -- | Associated Title | |
| Craker Brett | -- | Guardian Title | |
| Washington Mutual Bank Fsb | $75,515 | -- | |
| Pierce Brandon P | -- | First American Title |
Source: Public Records
Mortgage History
| Date | Status | Borrower | Loan Amount |
|---|---|---|---|
| Open | Linam Meladie Joy | $280,000 | |
| Previous Owner | Arnell Jack | $140,505 | |
| Previous Owner | Lemieux Joseph Brian | $127,400 | |
| Previous Owner | Smith Ryan R | $98,455 | |
| Previous Owner | Brunson Joshua R | $106,621 | |
| Previous Owner | Craker Brett | $84,268 | |
| Previous Owner | Pierce Brandon P | $67,200 |
Source: Public Records
Tax History
| Year | Tax Paid | Tax Assessment Tax Assessment Total Assessment is a certain percentage of the fair market value that is determined by local assessors to be the total taxable value of land and additions on the property. | Land | Improvement |
|---|---|---|---|---|
| 2025 | $2,288 | $356,775 | $120,013 | $236,762 |
| 2024 | $2,234 | $193,049 | $66,007 | $127,042 |
| 2023 | $2,144 | $185,350 | $65,968 | $119,382 |
| 2022 | $2,418 | $218,350 | $57,754 | $160,596 |
| 2021 | $2,004 | $297,000 | $80,017 | $216,983 |
| 2020 | $1,808 | $245,000 | $80,017 | $164,983 |
| 2019 | $1,694 | $215,000 | $45,015 | $169,985 |
| 2018 | $1,581 | $188,000 | $42,015 | $145,985 |
| 2017 | $1,470 | $163,000 | $42,015 | $120,985 |
| 2016 | $1,404 | $83,522 | $21,415 | $62,107 |
| 2015 | $1,276 | $77,186 | $21,415 | $55,771 |
| 2014 | $1,195 | $70,759 | $18,736 | $52,023 |
Source: Public Records
Map
Nearby Homes
- 5344 S 4300 W
- 5340 S 4300 W
- 5345 S 4250 W
- 5360 S 4300 W
- 5381 S 4250 W
- 4311 W 5300 S Unit 43
- 5341 S 4250 W
- 5399 S 4250 W
- 5335 S 4250 W
- 5332 S 4300 W
- 5323 S 4300 W
- 5331 S 4250 W
- 4325 W 5300 S Unit 50
- 4325 W 5300 S Unit 44
- 4325 W 5300 S
- 4249 W 5400 S
- 5326 S 4300 W
- 5337 S 4300 W
- 4276 W 5425 S
- 5386 S 4250 W
Your Personal Tour Guide
Ask me questions while you tour the home.