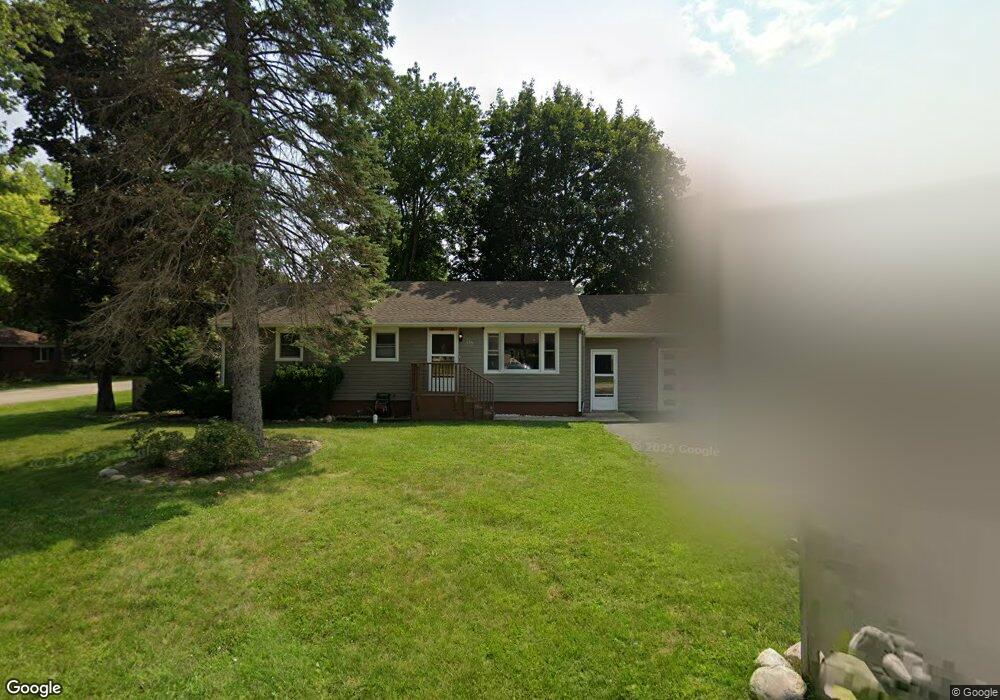
535 3rd Ave Marengo, IL 60152
Estimated Value: $272,000 - $315,408
3
Beds
2
Baths
1,400
Sq Ft
$207/Sq Ft
Est. Value
About This Home
This home is located at 535 3rd Ave, Marengo, IL 60152 and is currently estimated at $289,352, approximately $206 per square foot. 535 3rd Ave is a home located in McHenry County with nearby schools including Locust Elementary School, Marengo Community Middle School, and Marengo Community High School.
Ownership History
Date
Name
Owned For
Owner Type
Purchase Details
Closed on
Apr 15, 2025
Sold by
Rutkowski Joseph and Rutkowski Miranda
Bought by
Magana Jesus and Magana Isabel
Current Estimated Value
Home Financials for this Owner
Home Financials are based on the most recent Mortgage that was taken out on this home.
Original Mortgage
$75,000
Outstanding Balance
$74,667
Interest Rate
6.65%
Mortgage Type
Seller Take Back
Estimated Equity
$214,685
Purchase Details
Closed on
Feb 20, 2015
Sold by
Schirmer Paul W and Schirmer Dianem
Bought by
Rutkowski Joseph and Rutkowski Miranda
Home Financials for this Owner
Home Financials are based on the most recent Mortgage that was taken out on this home.
Original Mortgage
$138,380
Interest Rate
5.5%
Mortgage Type
FHA
Purchase Details
Closed on
Mar 14, 1998
Sold by
Dahl Thomas A and Dahl Joyce A
Bought by
Schirmer Paul W and Schirmer Diane M
Create a Home Valuation Report for This Property
The Home Valuation Report is an in-depth analysis detailing your home's value as well as a comparison with similar homes in the area
Home Values in the Area
Average Home Value in this Area
Purchase History
| Date | Buyer | Sale Price | Title Company |
|---|---|---|---|
| Magana Jesus | $275,000 | None Listed On Document | |
| Rutkowski Joseph | $160,000 | Heritage Title Company | |
| Schirmer Paul W | $108,000 | Fox Title Company |
Source: Public Records
Mortgage History
| Date | Status | Borrower | Loan Amount |
|---|---|---|---|
| Open | Magana Jesus | $75,000 | |
| Previous Owner | Rutkowski Joseph | $138,380 |
Source: Public Records
Tax History
| Year | Tax Paid | Tax Assessment Tax Assessment Total Assessment is a certain percentage of the fair market value that is determined by local assessors to be the total taxable value of land and additions on the property. | Land | Improvement |
|---|---|---|---|---|
| 2024 | $6,775 | $97,287 | $20,521 | $76,766 |
| 2023 | $6,576 | $85,761 | $18,090 | $67,671 |
| 2022 | $6,419 | $77,555 | $16,359 | $61,196 |
| 2021 | $5,959 | $70,665 | $14,906 | $55,759 |
| 2020 | $5,849 | $67,248 | $14,185 | $53,063 |
| 2019 | $6,177 | $63,718 | $13,440 | $50,278 |
| 2018 | $5,721 | $59,683 | $12,589 | $47,094 |
| 2017 | $5,527 | $56,534 | $11,925 | $44,609 |
| 2016 | $5,332 | $52,821 | $11,142 | $41,679 |
| 2013 | -- | $38,866 | $10,942 | $27,924 |
Source: Public Records
Map
Nearby Homes
- 906 N State St
- 567 7th Cir
- 350 8th Ave
- 726 Jackson St
- 915 Beaver Pond Dr
- 819 Whitetail Dr
- 817 Whitetail Dr
- 790 Cascade Dr
- 304 W Van Buren St
- 436 W Washington St
- 422 Damen St
- 00 Maple St
- 704 Echo (Lot 21) Trail
- 806 Echo (Lot 22) Trail
- 802 Echo (Lot 23) Trail
- 0 Deerpass Rd
- 214 S Prospect St
- 737 E Grant Hwy
- 0 Maple St
- 10 ac U S 20
Your Personal Tour Guide
Ask me questions while you tour the home.