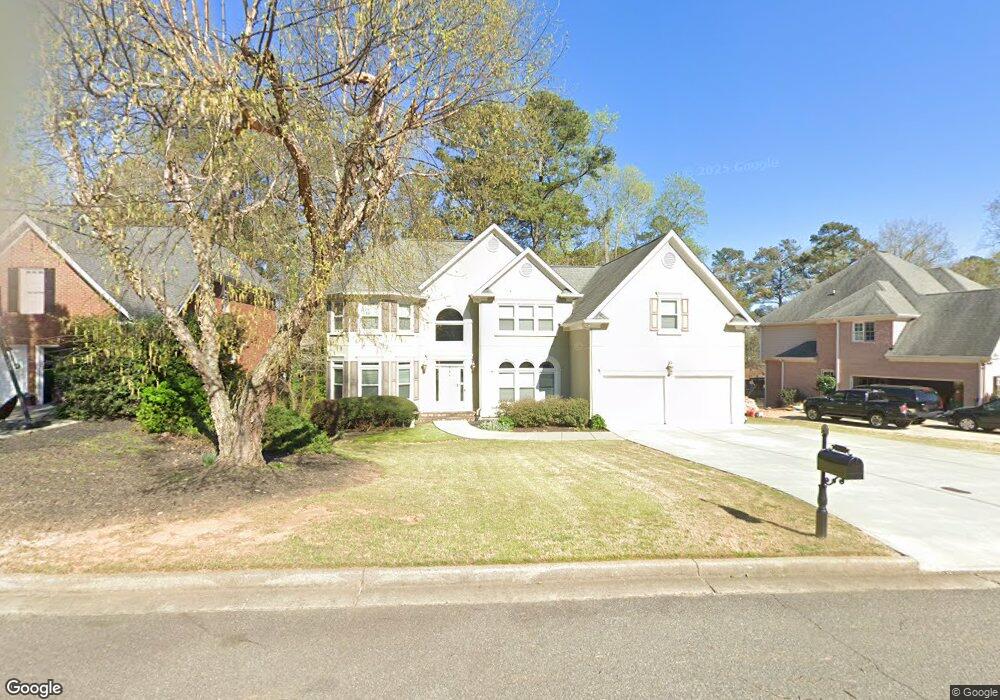
535 Brightmore Downs Alpharetta, GA 30005
Seven Oaks NeighborhoodEstimated Value: $867,143 - $915,000
6
Beds
6
Baths
3,598
Sq Ft
$248/Sq Ft
Est. Value
About This Home
This home is located at 535 Brightmore Downs, Alpharetta, GA 30005 and is currently estimated at $891,536, approximately $247 per square foot. 535 Brightmore Downs is a home located in Fulton County with nearby schools including River Trail Middle School, Northview High School, and McGinnis Woods School.
Ownership History
Date
Name
Owned For
Owner Type
Purchase Details
Closed on
Apr 15, 2010
Sold by
Rice Katherine H
Bought by
Shack Richard K and Shack Laura B
Current Estimated Value
Home Financials for this Owner
Home Financials are based on the most recent Mortgage that was taken out on this home.
Original Mortgage
$433,000
Outstanding Balance
$287,534
Interest Rate
4.94%
Mortgage Type
New Conventional
Estimated Equity
$604,002
Purchase Details
Closed on
Aug 11, 2002
Sold by
Tibbs Kimberly and Tibbs Calvin
Bought by
Cit/Grp Consumer Fin Inc
Purchase Details
Closed on
Aug 29, 2000
Sold by
Reti Relocation Services Inc
Bought by
Tibbs Kimberly R and Calvin J
Home Financials for this Owner
Home Financials are based on the most recent Mortgage that was taken out on this home.
Original Mortgage
$400,400
Interest Rate
8.17%
Mortgage Type
New Conventional
Purchase Details
Closed on
May 27, 1994
Sold by
Cedarbrook Homes Inc
Bought by
Hong Kitae Young H
Home Financials for this Owner
Home Financials are based on the most recent Mortgage that was taken out on this home.
Original Mortgage
$187,600
Interest Rate
8.52%
Create a Home Valuation Report for This Property
The Home Valuation Report is an in-depth analysis detailing your home's value as well as a comparison with similar homes in the area
Home Values in the Area
Average Home Value in this Area
Purchase History
| Date | Buyer | Sale Price | Title Company |
|---|---|---|---|
| Shack Richard K | $433,000 | -- | |
| Cit/Grp Consumer Fin Inc | $397,400 | -- | |
| Tibbs Kimberly R | $444,900 | -- | |
| Reti Relocation Services | $322,000 | -- | |
| Hong Kitae Young H | $268,000 | -- |
Source: Public Records
Mortgage History
| Date | Status | Borrower | Loan Amount |
|---|---|---|---|
| Open | Shack Richard K | $433,000 | |
| Previous Owner | Reti Relocation Services | $400,400 | |
| Previous Owner | Hong Kitae Young H | $187,600 |
Source: Public Records
Tax History
| Year | Tax Paid | Tax Assessment Tax Assessment Total Assessment is a certain percentage of the fair market value that is determined by local assessors to be the total taxable value of land and additions on the property. | Land | Improvement |
|---|---|---|---|---|
| 2025 | $5,695 | $307,600 | $66,360 | $241,240 |
| 2023 | $8,802 | $307,600 | $66,360 | $241,240 |
| 2022 | $5,451 | $235,640 | $49,560 | $186,080 |
| 2021 | $5,341 | $190,880 | $45,680 | $145,200 |
| 2020 | $5,312 | $181,640 | $32,560 | $149,080 |
| 2019 | $637 | $203,440 | $62,560 | $140,880 |
| 2018 | $5,596 | $184,080 | $61,080 | $123,000 |
| 2017 | $5,198 | $164,880 | $53,000 | $111,880 |
| 2016 | $5,115 | $164,880 | $53,000 | $111,880 |
| 2015 | $5,171 | $164,880 | $53,000 | $111,880 |
| 2014 | $4,668 | $145,400 | $46,760 | $98,640 |
Source: Public Records
Map
Nearby Homes
- 5735 Sunset Maple Dr
- 5620 Preserve Cir
- 12313 Sunset Maple Terrace
- 7170 Collingsworth Place
- 7530 Newstead Dr
- 140 Ashewoode Downs Ln
- 7505 Brookwood Way
- 5635 Ashewoode Downs Dr
- 12030 S Magnolia Cir
- 5480 Vicarage Walk
- 820 Yearling Chase
- 7260 Fawn Lake Dr
- 3715 Lakeheath Dr
- 3180 Caney Creek Ln
- 700 Doe Ct
- 230 Leaf Ct Unit 604
- 3185 Raskarity Rd
- 5785 Oxborough Way Unit 1
- 12595 Huntington Trace
- 1105 Dapplefawn Ct
- 545 Brightmore Downs
- 525 Brightmore Downs
- 555 Brightmore Downs Unit 3A
- 515 Brightmore Downs
- 550 Brightmore Downs
- 155 Brightmore Way
- 165 Brightmore Way Unit 3C
- 540 Brightmore Downs Unit 3A
- 560 Brightmore Downs Unit 3A
- 505 Brightmore Downs Unit 3A
- 570 Brightmore Downs
- 530 Brightmore Downs
- 145 Brightmore Way
- 565 Brightmore Downs Unit 3A
- 175 Brightmore Way Unit 3C
- 580 Brightmore Downs
- 495 Brightmore Downs Unit 3A
- 520 Brightmore Downs Unit 3
- 575 Brightmore Downs Unit 3A
- 135 Brightmore Way
Your Personal Tour Guide
Ask me questions while you tour the home.