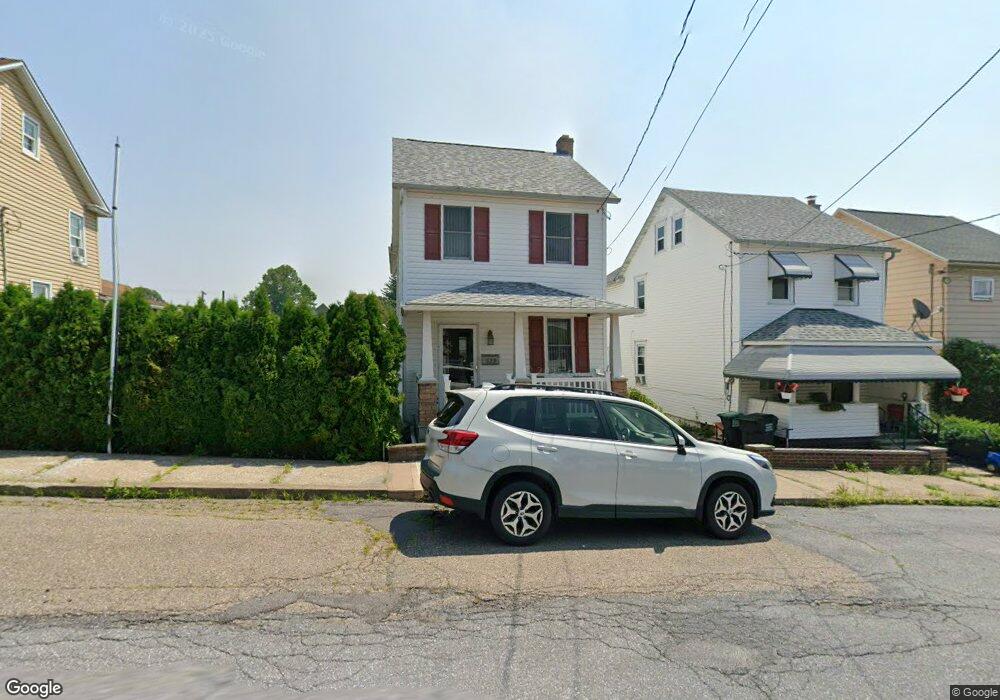
535 Cedar St Freeland, PA 18224
Estimated Value: $135,000 - $186,000
3
Beds
1
Bath
2,264
Sq Ft
$70/Sq Ft
Est. Value
About This Home
This home is located at 535 Cedar St, Freeland, PA 18224 and is currently estimated at $158,605, approximately $70 per square foot. 535 Cedar St is a home located in Luzerne County with nearby schools including Hazleton Area High School and Mmi Preparatory School.
Ownership History
Date
Name
Owned For
Owner Type
Purchase Details
Closed on
May 20, 2020
Sold by
Smith Stewart
Bought by
Lozano Ceasar Roberto
Current Estimated Value
Home Financials for this Owner
Home Financials are based on the most recent Mortgage that was taken out on this home.
Original Mortgage
$107,908
Outstanding Balance
$95,621
Interest Rate
3.3%
Mortgage Type
FHA
Estimated Equity
$62,984
Purchase Details
Closed on
Aug 9, 2001
Bought by
Smith Stewart
Create a Home Valuation Report for This Property
The Home Valuation Report is an in-depth analysis detailing your home's value as well as a comparison with similar homes in the area
Home Values in the Area
Average Home Value in this Area
Purchase History
| Date | Buyer | Sale Price | Title Company |
|---|---|---|---|
| Lozano Ceasar Roberto | $109,900 | Covenant Abstract | |
| Smith Stewart | $18,000 | -- |
Source: Public Records
Mortgage History
| Date | Status | Borrower | Loan Amount |
|---|---|---|---|
| Open | Lozano Ceasar Roberto | $107,908 |
Source: Public Records
Tax History Compared to Growth
Tax History
| Year | Tax Paid | Tax Assessment Tax Assessment Total Assessment is a certain percentage of the fair market value that is determined by local assessors to be the total taxable value of land and additions on the property. | Land | Improvement |
|---|---|---|---|---|
| 2025 | $1,641 | $66,000 | $21,500 | $44,500 |
| 2024 | $1,586 | $66,000 | $21,500 | $44,500 |
| 2023 | $1,561 | $66,000 | $21,500 | $44,500 |
| 2022 | $1,544 | $66,000 | $21,500 | $44,500 |
| 2021 | $1,506 | $66,000 | $21,500 | $44,500 |
| 2020 | $1,418 | $66,000 | $21,500 | $44,500 |
| 2019 | $1,368 | $66,000 | $21,500 | $44,500 |
| 2018 | $1,325 | $66,000 | $21,500 | $44,500 |
| 2017 | $1,301 | $66,000 | $21,500 | $44,500 |
| 2016 | -- | $66,000 | $21,500 | $44,500 |
| 2015 | $641 | $66,000 | $21,500 | $44,500 |
| 2014 | $641 | $66,000 | $21,500 | $44,500 |
Source: Public Records
Map
Nearby Homes