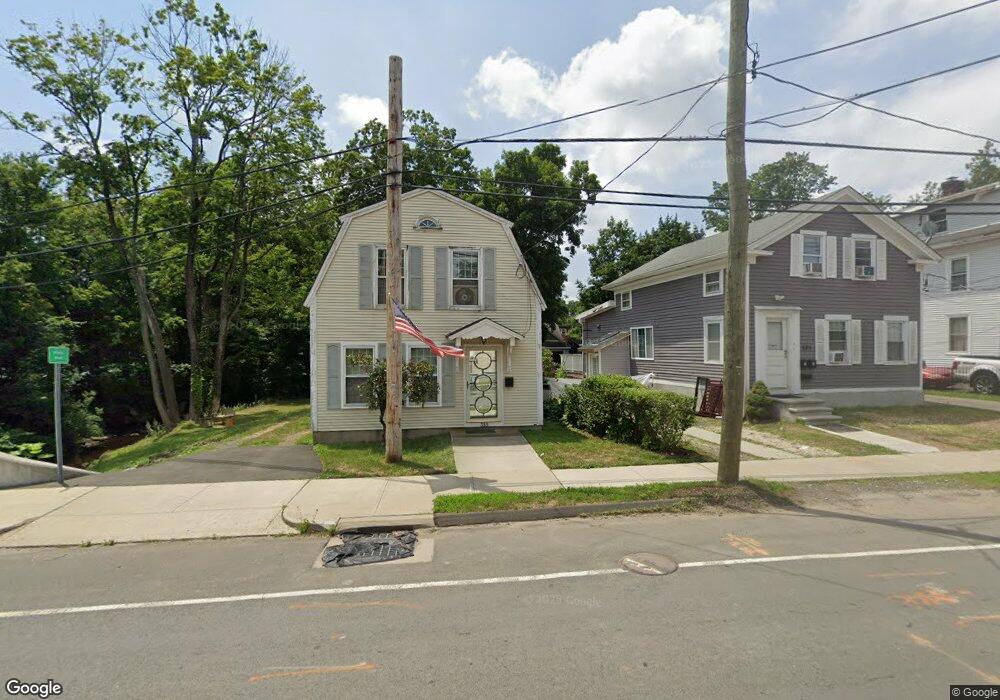
535 Center St Wallingford, CT 06492
Estimated Value: $354,000 - $396,000
3
Beds
2
Baths
1,330
Sq Ft
$277/Sq Ft
Est. Value
About This Home
This home is located at 535 Center St, Wallingford, CT 06492 and is currently estimated at $368,495, approximately $277 per square foot. 535 Center St is a home located in New Haven County with nearby schools including Evarts C. Stevens School, Pond Hill Elementary School, and Dag Hammarskjold Middle School.
Ownership History
Date
Name
Owned For
Owner Type
Purchase Details
Closed on
Sep 20, 2005
Sold by
Gallo David
Bought by
Tepaske Susan
Current Estimated Value
Home Financials for this Owner
Home Financials are based on the most recent Mortgage that was taken out on this home.
Original Mortgage
$204,155
Outstanding Balance
$109,155
Interest Rate
5.84%
Estimated Equity
$259,340
Purchase Details
Closed on
Nov 27, 1996
Sold by
Iannotti Charles and Iannotti Donna L
Bought by
Scott Andrea L and Gallo David A
Home Financials for this Owner
Home Financials are based on the most recent Mortgage that was taken out on this home.
Original Mortgage
$95,200
Interest Rate
7.82%
Mortgage Type
Unknown
Purchase Details
Closed on
Jan 30, 1991
Sold by
Mik Paul F
Bought by
Iannotti Charles J and Iannotti Donna L
Purchase Details
Closed on
Sep 22, 1989
Sold by
Briarwood Bldrs
Bought by
Mik Paul F
Create a Home Valuation Report for This Property
The Home Valuation Report is an in-depth analysis detailing your home's value as well as a comparison with similar homes in the area
Home Values in the Area
Average Home Value in this Area
Purchase History
| Date | Buyer | Sale Price | Title Company |
|---|---|---|---|
| Tepaske Susan | $214,900 | -- | |
| Scott Andrea L | $119,000 | -- | |
| Tepaske Susan | $214,900 | -- | |
| Scott Andrea L | $119,000 | -- | |
| Iannotti Charles J | $126,500 | -- | |
| Mik Paul F | $44,750 | -- |
Source: Public Records
Mortgage History
| Date | Status | Borrower | Loan Amount |
|---|---|---|---|
| Open | Mik Paul F | $204,155 | |
| Closed | Mik Paul F | $204,155 | |
| Previous Owner | Mik Paul F | $95,200 |
Source: Public Records
Tax History
| Year | Tax Paid | Tax Assessment Tax Assessment Total Assessment is a certain percentage of the fair market value that is determined by local assessors to be the total taxable value of land and additions on the property. | Land | Improvement |
|---|---|---|---|---|
| 2025 | $5,075 | $210,400 | $84,400 | $126,000 |
| 2024 | $4,685 | $152,800 | $76,000 | $76,800 |
| 2023 | $0 | $152,800 | $76,000 | $76,800 |
| 2022 | $0 | $152,800 | $76,000 | $76,800 |
| 2021 | $0 | $152,800 | $76,000 | $76,800 |
| 2020 | $0 | $152,200 | $81,000 | $71,200 |
| 2019 | $0 | $152,200 | $81,000 | $71,200 |
| 2018 | $0 | $152,200 | $81,000 | $71,200 |
| 2017 | $0 | $152,200 | $81,000 | $71,200 |
| 2016 | -- | $152,200 | $81,000 | $71,200 |
| 2015 | -- | $154,100 | $81,000 | $73,100 |
| 2014 | -- | $154,100 | $81,000 | $73,100 |
Source: Public Records
Map
Nearby Homes
- 46 Walnut Ln
- 85 N Colony St
- 42 S Cherry St Unit 238
- 120 S Cherry St
- 70 Putter Dr Unit 211
- 570 N Main St
- 71 Cedar Ln
- 1 Dean Dr
- 69 Terrace Gardens
- 90 Masonic Ave
- 30 Clinton Place
- 57 Terrace Gardens Unit 57
- 31 S Turnpike Rd Unit C2
- 19 Perkins Dr
- 5 Kish Place
- 89 Saw Mill Dr
- 70 N Turnpike Rd Unit 21
- 61 Cheshire Rd
- 27 Tamarac Swamp Rd
- 513 Pilgrim Harbor
- 533 Center St
- 533 Center St Unit 2
- 533 Center St Unit 1
- 525 Center St
- 20 Hoffman Ct
- 530 Center St Unit A9
- 530 Center St Unit A8
- 530 Center St Unit A7
- 530 Center St Unit A6
- 530 Center St Unit A5
- 530 Center St Unit A4
- 530 Center St Unit A3
- 530 Center St Unit E1
- 530 Center St Unit D1
- 530 Center St Unit C6
- 530 Center St Unit C5
- 530 Center St Unit C4
- 530 Center St Unit C3
- 530 Center St Unit C2
- 530 Center St Unit B9
Your Personal Tour Guide
Ask me questions while you tour the home.