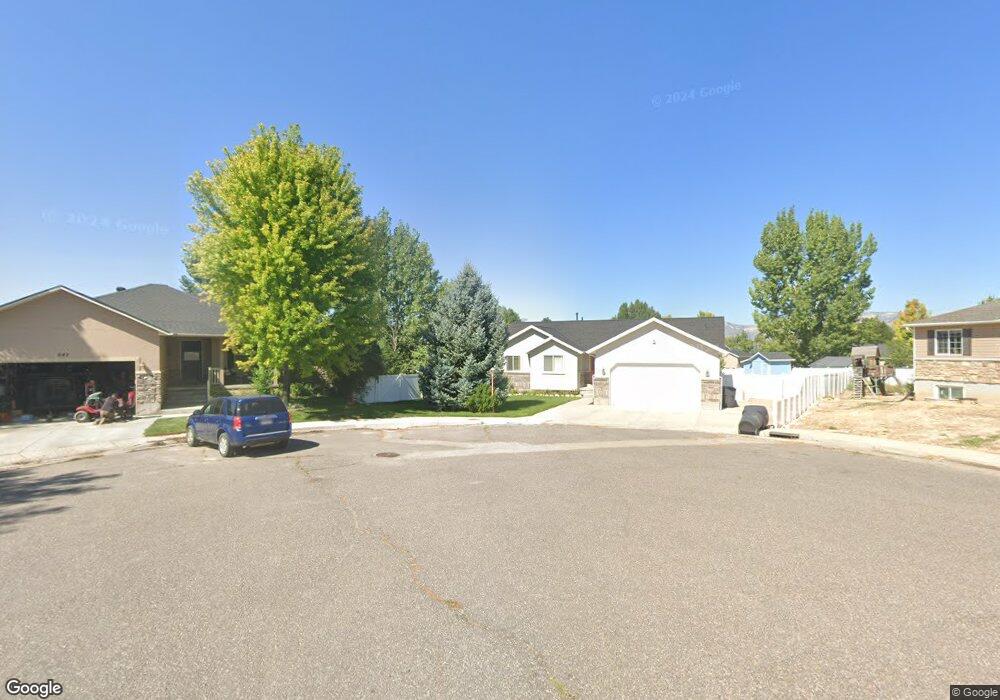
535 E 30 N Ephraim, UT 84627
Estimated Value: $441,000 - $508,000
5
Beds
3
Baths
3,396
Sq Ft
$143/Sq Ft
Est. Value
About This Home
This home is located at 535 E 30 N, Ephraim, UT 84627 and is currently estimated at $484,871, approximately $142 per square foot. 535 E 30 N is a home located in Sanpete County.
Ownership History
Date
Name
Owned For
Owner Type
Purchase Details
Closed on
Jul 5, 2024
Sold by
Pontius Terri J
Bought by
Catmull Trevor
Current Estimated Value
Home Financials for this Owner
Home Financials are based on the most recent Mortgage that was taken out on this home.
Original Mortgage
$384,000
Outstanding Balance
$367,574
Interest Rate
0.68%
Mortgage Type
Construction
Estimated Equity
$117,297
Purchase Details
Closed on
Jun 5, 2019
Sold by
Tyler Newton and Tyler Samantha
Bought by
Pontius Terri J
Home Financials for this Owner
Home Financials are based on the most recent Mortgage that was taken out on this home.
Original Mortgage
$215,250
Interest Rate
4.2%
Mortgage Type
New Conventional
Create a Home Valuation Report for This Property
The Home Valuation Report is an in-depth analysis detailing your home's value as well as a comparison with similar homes in the area
Home Values in the Area
Average Home Value in this Area
Purchase History
| Date | Buyer | Sale Price | Title Company |
|---|---|---|---|
| Catmull Trevor | $480,000 | Trident Title Ins Agcy | |
| Pontius Terri J | $269,062 | Bahamma Title |
Source: Public Records
Mortgage History
| Date | Status | Borrower | Loan Amount |
|---|---|---|---|
| Open | Catmull Trevor | $384,000 | |
| Previous Owner | Pontius Terri J | $215,250 |
Source: Public Records
Tax History
| Year | Tax Paid | Tax Assessment Tax Assessment Total Assessment is a certain percentage of the fair market value that is determined by local assessors to be the total taxable value of land and additions on the property. | Land | Improvement |
|---|---|---|---|---|
| 2025 | $2,810 | $272,287 | $0 | $0 |
| 2024 | $2,834 | $260,978 | $0 | $0 |
| 2023 | $2,796 | $245,050 | $0 | $0 |
| 2022 | $2,786 | $222,465 | $0 | $0 |
| 2021 | $2,695 | $186,012 | $0 | $0 |
| 2020 | $2,504 | $162,666 | $0 | $0 |
| 2019 | $2,362 | $150,991 | $0 | $0 |
| 2018 | $2,131 | $238,720 | $31,680 | $207,040 |
| 2017 | $1,705 | $109,947 | $0 | $0 |
| 2016 | $1,612 | $103,957 | $0 | $0 |
| 2015 | $1,620 | $103,957 | $0 | $0 |
| 2014 | $1,593 | $103,957 | $0 | $0 |
| 2013 | $1,586 | $103,957 | $0 | $0 |
Source: Public Records
Map
Nearby Homes
Your Personal Tour Guide
Ask me questions while you tour the home.