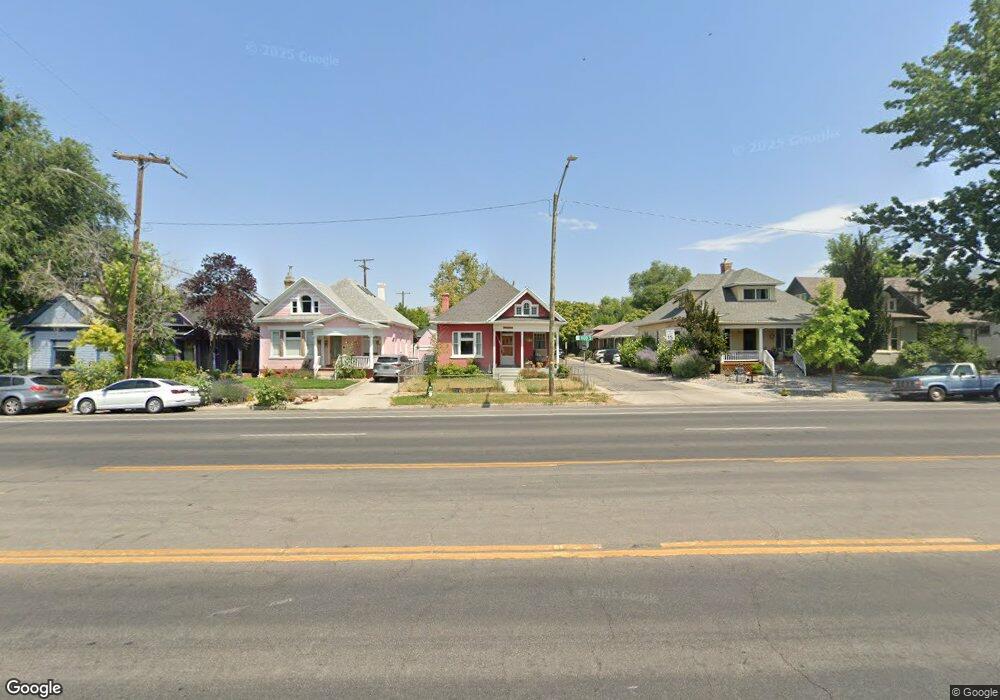
535 E 800 S Salt Lake City, UT 84102
Central City NeighborhoodEstimated Value: $478,000 - $528,000
2
Beds
1
Bath
2,226
Sq Ft
$230/Sq Ft
Est. Value
About This Home
This home is located at 535 E 800 S, Salt Lake City, UT 84102 and is currently estimated at $511,214, approximately $229 per square foot. 535 E 800 S is a home located in Salt Lake County with nearby schools including Bennion Elementary School, Liberty Elementary School, and Highland High School.
Ownership History
Date
Name
Owned For
Owner Type
Purchase Details
Closed on
Jun 9, 2021
Sold by
Montano Kirk Toby and Sharon Belle Montana Family Tr
Bought by
Galvin Hillary
Current Estimated Value
Purchase Details
Closed on
Aug 1, 2018
Sold by
Montano Kirk Toby and Montano Sharon Belle
Bought by
Montano Kirk Toby and Sharon Belle Montano Family Tr
Purchase Details
Closed on
Jun 18, 2018
Sold by
Montano Kirk Toby and Montano Sharon Belle
Bought by
Montano Sharon Belle and The Sharon Belle Montano Famil
Purchase Details
Closed on
Jan 18, 2013
Sold by
Pierce Roland D
Bought by
Pierce Roland Dean and Montans Sharon Belle
Create a Home Valuation Report for This Property
The Home Valuation Report is an in-depth analysis detailing your home's value as well as a comparison with similar homes in the area
Home Values in the Area
Average Home Value in this Area
Purchase History
| Date | Buyer | Sale Price | Title Company |
|---|---|---|---|
| Galvin Hillary | -- | Cottonwood Title | |
| Montano Kirk Toby | -- | None Available | |
| Montano Sharon Belle | -- | None Available | |
| Pierce Roland Dean | -- | None Available |
Source: Public Records
Tax History Compared to Growth
Tax History
| Year | Tax Paid | Tax Assessment Tax Assessment Total Assessment is a certain percentage of the fair market value that is determined by local assessors to be the total taxable value of land and additions on the property. | Land | Improvement |
|---|---|---|---|---|
| 2025 | $2,255 | $449,100 | $150,900 | $298,200 |
| 2024 | $2,255 | $430,300 | $142,800 | $287,500 |
| 2023 | $2,248 | $413,500 | $137,300 | $276,200 |
| 2022 | $2,615 | $451,300 | $105,500 | $345,800 |
| 2021 | $2,101 | $328,300 | $82,700 | $245,600 |
| 2020 | $1,391 | $206,800 | $82,900 | $123,900 |
| 2019 | $1,466 | $205,100 | $61,200 | $143,900 |
| 2018 | $1,434 | $195,400 | $61,200 | $134,200 |
| 2017 | $1,471 | $187,800 | $61,200 | $126,600 |
| 2016 | $1,403 | $170,100 | $53,500 | $116,600 |
| 2015 | $1,403 | $161,200 | $52,500 | $108,700 |
| 2014 | $1,412 | $160,900 | $54,100 | $106,800 |
Source: Public Records
Map
Nearby Homes