Estimated Value: $418,976 - $465,000
--
Bed
2
Baths
3,021
Sq Ft
$146/Sq Ft
Est. Value
About This Home
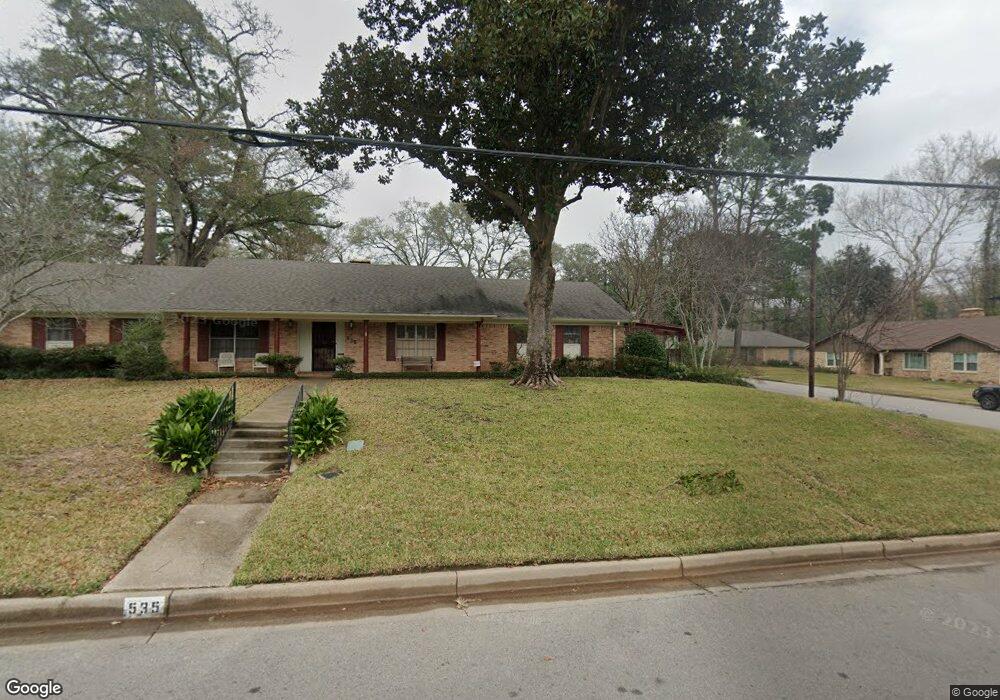
This home is located at 535 Fair Ln, Tyler, TX 75701 and is currently estimated at $439,744, approximately $145 per square foot. 535 Fair Ln is a home located in Smith County with nearby schools including Woods Elementary School, Hogg Middle School, and Tyler Legacy High School.
Create a Home Valuation Report for This Property
The Home Valuation Report is an in-depth analysis detailing your home's value as well as a comparison with similar homes in the area
Home Values in the Area
Average Home Value in this Area
Tax History Compared to Growth
Tax History
| Year | Tax Paid | Tax Assessment Tax Assessment Total Assessment is a certain percentage of the fair market value that is determined by local assessors to be the total taxable value of land and additions on the property. | Land | Improvement |
|---|---|---|---|---|
| 2025 | $2,220 | $493,746 | $103,734 | $390,012 |
| 2024 | $2,220 | $374,733 | $58,905 | $401,576 |
| 2023 | $5,938 | $436,213 | $58,905 | $377,308 |
| 2022 | $6,067 | $322,251 | $39,270 | $282,981 |
| 2021 | $5,907 | $281,542 | $39,270 | $242,272 |
| 2020 | $6,122 | $286,108 | $39,270 | $246,838 |
| 2019 | $5,848 | $267,458 | $39,270 | $228,188 |
| 2018 | $5,687 | $261,457 | $39,270 | $222,187 |
| 2017 | $5,582 | $261,457 | $39,270 | $222,187 |
| 2016 | $5,376 | $251,794 | $39,270 | $212,524 |
| 2015 | $4,013 | $244,598 | $39,270 | $205,328 |
| 2014 | $4,013 | $245,210 | $39,270 | $205,940 |
Source: Public Records
Map
Nearby Homes
- 0 Us Highway 271
- 2917 Sunnybrook Dr
- 509 Buckingham Place
- 505 Buckingham Place
- 403 Beechwood Dr
- 640 Beechwood Dr
- 309 Glenhaven Dr
- 3300 Old Bullard Rd
- 3308 Greenoak Place
- 789 Fairmont Dr
- 121 Fair Ln
- 1111 Beechwood Dr
- 3324 Teakwood Dr
- 2736 Old Bullard Rd
- 2835 S Broadway Ave
- 3045 Concord Place
- 3048 Concord Place
- 2900 S Robertson Ave
- 2622 Oak Ln
- 3404 Silverwood Dr