535 Grey Eagle Ln Unit Lot 52 Fernley, NV 89408
Estimated Value: $435,299 - $544,000
4
Beds
3
Baths
2,200
Sq Ft
$216/Sq Ft
Est. Value
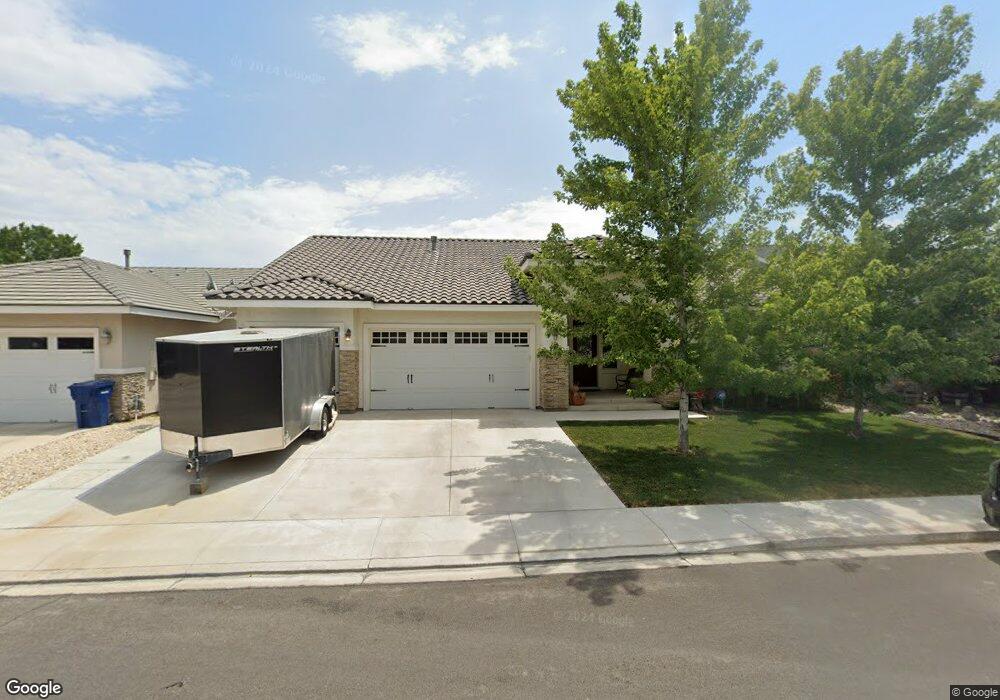
About This Home
This home is located at 535 Grey Eagle Ln Unit Lot 52, Fernley, NV 89408 and is currently estimated at $475,575, approximately $216 per square foot. 535 Grey Eagle Ln Unit Lot 52 is a home located in Lyon County with nearby schools including Fernley Elementary School, Fernley Intermediate School, and Fernley High School.
Ownership History
Date
Name
Owned For
Owner Type
Purchase Details
Closed on
Oct 26, 2015
Sold by
Kelly Patrick E and Kelly Jacqueline A
Bought by
Sloop Timothy and Sloop Teresa
Current Estimated Value
Purchase Details
Closed on
Dec 13, 2011
Sold by
Fannie Mae
Bought by
Kelly Patrick E and Kelly Jacqueline A
Home Financials for this Owner
Home Financials are based on the most recent Mortgage that was taken out on this home.
Original Mortgage
$133,039
Interest Rate
3.75%
Mortgage Type
FHA
Purchase Details
Closed on
May 14, 2010
Sold by
Woolsey William Frank
Bought by
Fannie Mae and Federal National Mortgage Association
Purchase Details
Closed on
May 8, 2008
Sold by
Woolsey William F and Woolsey Leslie
Bought by
Woolsey William Frank
Create a Home Valuation Report for This Property
The Home Valuation Report is an in-depth analysis detailing your home's value as well as a comparison with similar homes in the area
Home Values in the Area
Average Home Value in this Area
Purchase History
| Date | Buyer | Sale Price | Title Company |
|---|---|---|---|
| Sloop Timothy | $243,000 | Ticor Title Reno Main | |
| Kelly Patrick E | $136,500 | Servicelink | |
| Fannie Mae | $258,397 | Lsi Title Agency | |
| Woolsey William Frank | -- | Western Nevada Title Co | |
| Woolsey William F | -- | Western Nevada Title Co |
Source: Public Records
Mortgage History
| Date | Status | Borrower | Loan Amount |
|---|---|---|---|
| Previous Owner | Kelly Patrick E | $133,039 |
Source: Public Records
Tax History Compared to Growth
Tax History
| Year | Tax Paid | Tax Assessment Tax Assessment Total Assessment is a certain percentage of the fair market value that is determined by local assessors to be the total taxable value of land and additions on the property. | Land | Improvement |
|---|---|---|---|---|
| 2025 | $2,975 | $136,005 | $36,750 | $99,255 |
| 2024 | $3,297 | $136,369 | $36,750 | $99,619 |
| 2023 | $3,297 | $130,093 | $36,750 | $93,343 |
| 2022 | $2,973 | $122,711 | $36,750 | $85,961 |
| 2021 | $2,809 | $116,972 | $33,250 | $83,722 |
| 2020 | $2,629 | $113,448 | $33,250 | $80,198 |
| 2019 | $2,507 | $105,217 | $28,000 | $77,217 |
| 2018 | $2,412 | $89,991 | $14,700 | $75,291 |
| 2017 | $2,365 | $85,695 | $10,500 | $75,195 |
| 2016 | $2,160 | $74,894 | $5,780 | $69,114 |
| 2015 | $2,194 | $76,370 | $5,780 | $70,590 |
| 2014 | $2,141 | $50,202 | $5,780 | $44,422 |
Source: Public Records
Map
Nearby Homes
- 535 Grey Eagle Ln
- 545 Grey Eagle Ln
- 525 Grey Eagle Ln
- 560 White Eagle Ln
- 570 White Eagle Ln
- 550 White Eagle Ln Unit Lot 46
- 550 White Eagle Ln
- 555 Grey Eagle Ln
- 515 Grey Eagle Ln
- 580 White Eagle Ln
- 540 White Eagle Ln Unit Lot 47
- 540 White Eagle Ln
- 534 Grey Eagle Ln
- 544 Grey Eagle Ln
- 524 Grey Eagle Ln
- 565 Grey Eagle Ln
- 505 Grey Eagle Ln
- 554 Grey Eagle Ln
- 514 Grey Eagle Ln
- 590 White Eagle Ln