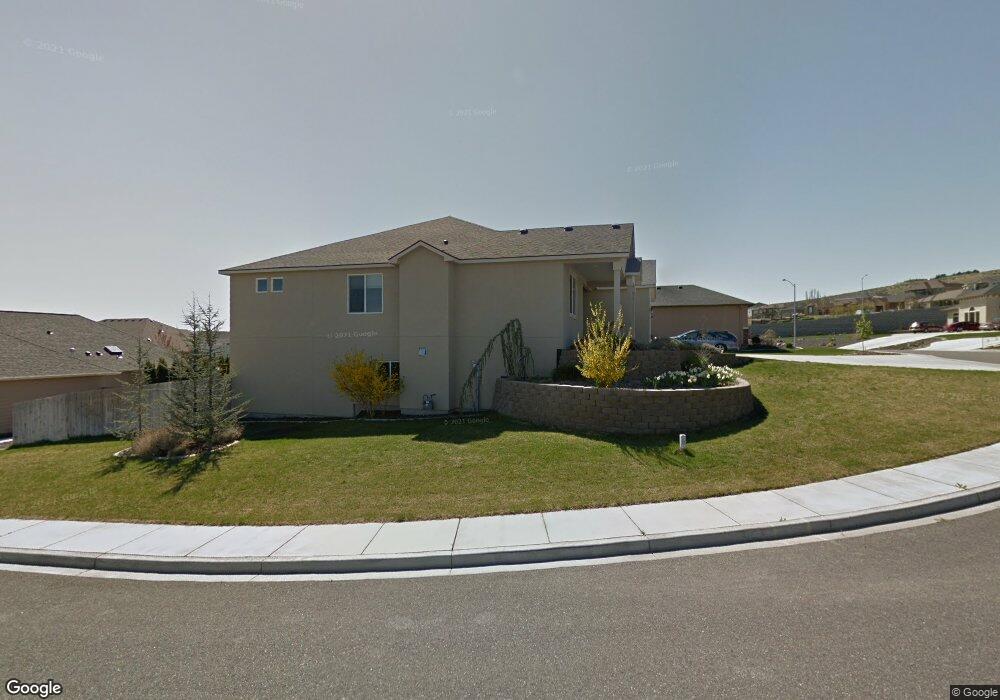
535 Lodi Loop Richland, WA 99352
Estimated Value: $685,000 - $842,000
3
Beds
3
Baths
2,035
Sq Ft
$356/Sq Ft
Est. Value
About This Home
This home is located at 535 Lodi Loop, Richland, WA 99352 and is currently estimated at $724,701, approximately $356 per square foot. 535 Lodi Loop is a home located in Benton County with nearby schools including Orchard Elementary School, Enterprise Middle School, and Richland High School.
Ownership History
Date
Name
Owned For
Owner Type
Purchase Details
Closed on
Jan 17, 2013
Sold by
Kernan Warnick J and Kernan Susan D
Bought by
Kernan Warnick J and Kernan Susan D
Current Estimated Value
Purchase Details
Closed on
Sep 11, 2007
Sold by
B & B Construction Inc
Bought by
Kernan Warnick J and Kernan Susan D
Home Financials for this Owner
Home Financials are based on the most recent Mortgage that was taken out on this home.
Original Mortgage
$376,100
Outstanding Balance
$239,339
Interest Rate
6.67%
Mortgage Type
Purchase Money Mortgage
Estimated Equity
$485,362
Purchase Details
Closed on
Oct 23, 2006
Sold by
Jvz & Mvz Enterprises Llc
Bought by
B & B Construction Inc
Home Financials for this Owner
Home Financials are based on the most recent Mortgage that was taken out on this home.
Original Mortgage
$308,000
Interest Rate
6.39%
Mortgage Type
Construction
Create a Home Valuation Report for This Property
The Home Valuation Report is an in-depth analysis detailing your home's value as well as a comparison with similar homes in the area
Home Values in the Area
Average Home Value in this Area
Purchase History
| Date | Buyer | Sale Price | Title Company |
|---|---|---|---|
| Kernan Warnick J | -- | None Available | |
| Kernan Warnick J | $410,000 | Benton Franklin Titl | |
| B & B Construction Inc | $47,500 | Benton Franklin Titl |
Source: Public Records
Mortgage History
| Date | Status | Borrower | Loan Amount |
|---|---|---|---|
| Open | Kernan Warnick J | $376,100 | |
| Previous Owner | B & B Construction Inc | $308,000 |
Source: Public Records
Tax History Compared to Growth
Tax History
| Year | Tax Paid | Tax Assessment Tax Assessment Total Assessment is a certain percentage of the fair market value that is determined by local assessors to be the total taxable value of land and additions on the property. | Land | Improvement |
|---|---|---|---|---|
| 2024 | $6,035 | $664,890 | $85,000 | $579,890 |
| 2023 | $6,035 | $647,830 | $85,000 | $562,830 |
| 2022 | $5,644 | $579,610 | $85,000 | $494,610 |
| 2021 | $5,104 | $511,390 | $85,000 | $426,390 |
| 2020 | $4,915 | $443,170 | $85,000 | $358,170 |
| 2019 | $4,569 | $403,410 | $58,000 | $345,410 |
| 2018 | $4,684 | $403,410 | $58,000 | $345,410 |
| 2017 | $4,140 | $345,840 | $58,000 | $287,840 |
| 2016 | $4,519 | $345,840 | $58,000 | $287,840 |
| 2015 | $4,587 | $345,840 | $58,000 | $287,840 |
| 2014 | -- | $345,840 | $58,000 | $287,840 |
| 2013 | -- | $345,840 | $58,000 | $287,840 |
Source: Public Records
Map
Nearby Homes
- 586 Lodi Loop
- 1472 Chardonnay Dr
- 585 Burton Ct
- 1240 Vintage Ave
- 1269 Jubilee St
- 403 Cherry Blossom Loop
- 1101 Fairhaven Loop
- 1102 Fairhaven Loop Unit 34
- 713 Mara Loop
- 1376 Tuscany Place
- 1113 Fairhaven Loop Unit 4
- 1117 Fairhaven Loop Unit 5
- 766 Mara Loop
- 1106 Fairhaven Loop Unit 33
- 736 Mara Loop
- 652 Punkie Ln
- 730 Mara Loop
- 1638 Naples Ln
- 1557 Livorno Ave
- 683 Isola Vista Ct
- 557 Lodi Loop
- 523 Lodi Loop Unit Gorgeous Hardwood fl
- 523 Lodi Loop Unit INCREDIBLE "LOW MAIN
- 523 Lodi Loop
- 576 Lodi Loop
- 526 Lodi Loop
- 546 Lodi Loop
- 520 Lodi Loop
- 552 Lodi Loop
- 540 Lodi Loop
- 515 Lodi Loop
- 587 Lodi Loop
- 572 Lodi Loop
- 512 Lodi Loop
- 580 Lodi Loop
- 558 Lodi Loop
- 1483 Chardonnay Dr
- 1469 Chardonnay Dr
- 1358 Apple Cider Ct
- 1364 Apple Cider Ct