Estimated Value: $27,600 - $321,000
3
Beds
1
Bath
1,758
Sq Ft
$102/Sq Ft
Est. Value
About This Home
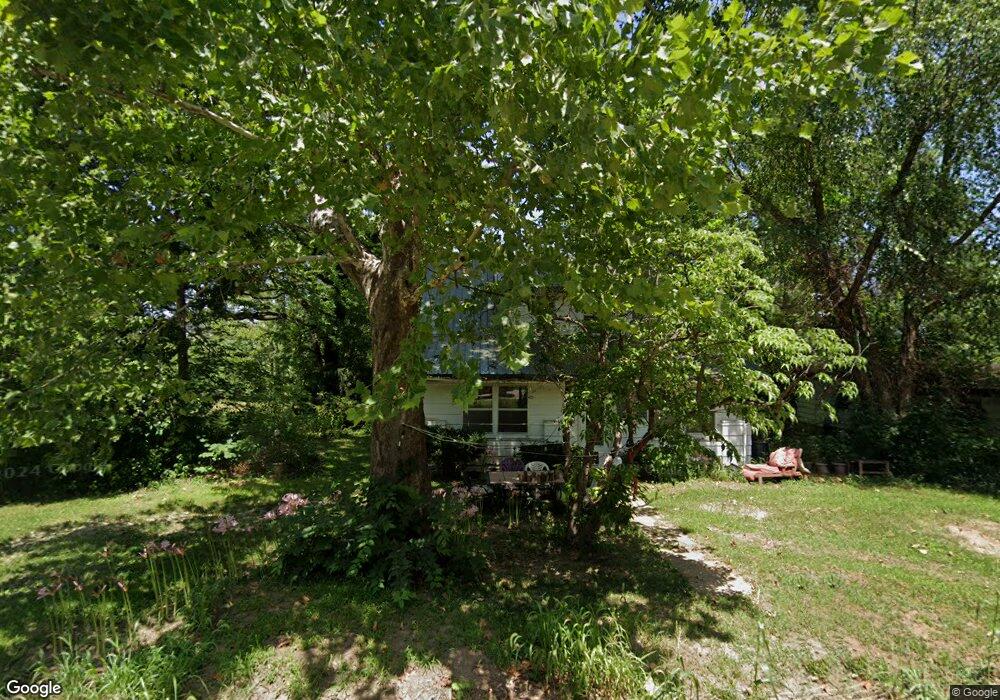
This home is located at 535 Main St, Olean, MO 65064 and is currently estimated at $179,650, approximately $102 per square foot. 535 Main St is a home located in Miller County with nearby schools including South Elementary School, Eldon Upper Elementary School, and Eldon Middle School.
Ownership History
Date
Name
Owned For
Owner Type
Purchase Details
Closed on
Sep 11, 2018
Sold by
Miller County
Bought by
Guyot Charmaine E
Current Estimated Value
Purchase Details
Closed on
Jun 29, 2016
Sold by
Dmp Holdings Llc
Bought by
Ingersoll Financial Midwest Land Trust
Purchase Details
Closed on
Jun 28, 2016
Sold by
Harbour Portfolio Vii Lp
Bought by
Dmp Holdings Llc
Purchase Details
Closed on
May 14, 2013
Sold by
Harbour Portfolio Viii Lp
Bought by
Cotten Truly Ann
Purchase Details
Closed on
Dec 26, 2012
Sold by
Secretary Of Housing And Urban Developme
Bought by
Harbour Portfolio Vp Lp
Purchase Details
Closed on
Mar 6, 2007
Sold by
Stark David E and Stark Rhonda K
Bought by
Stark Brandon Keith and Ridge Jessica Ann
Home Financials for this Owner
Home Financials are based on the most recent Mortgage that was taken out on this home.
Original Mortgage
$62,009
Interest Rate
6.26%
Mortgage Type
FHA
Create a Home Valuation Report for This Property
The Home Valuation Report is an in-depth analysis detailing your home's value as well as a comparison with similar homes in the area
Purchase History
| Date | Buyer | Sale Price | Title Company |
|---|---|---|---|
| Guyot Charmaine E | $900 | None Available | |
| Guyot Charmaine E | $900 | None Available | |
| Ingersoll Financial Midwest Land Trust | -- | None Available | |
| Dmp Holdings Llc | $1,850 | None Available | |
| Cotten Truly Ann | $34,825 | None Available | |
| Harbour Portfolio Vp Lp | -- | None Available | |
| Stark Brandon Keith | -- | None Available |
Source: Public Records
Mortgage History
| Date | Status | Borrower | Loan Amount |
|---|---|---|---|
| Previous Owner | Stark Brandon Keith | $62,009 |
Source: Public Records
Tax History
| Year | Tax Paid | Tax Assessment Tax Assessment Total Assessment is a certain percentage of the fair market value that is determined by local assessors to be the total taxable value of land and additions on the property. | Land | Improvement |
|---|---|---|---|---|
| 2025 | $246 | $4,720 | $1,830 | $2,890 |
| 2024 | $224 | $4,120 | $1,660 | $2,460 |
| 2023 | $224 | $4,120 | $1,660 | $2,460 |
| 2022 | $223 | $4,120 | $1,660 | $2,460 |
| 2021 | $213 | $3,940 | $1,660 | $2,280 |
| 2020 | $212 | $3,870 | $1,660 | $2,210 |
| 2019 | $212 | $3,870 | $1,660 | $2,210 |
| 2018 | $171 | $3,870 | $1,660 | $2,210 |
| 2017 | $168 | $3,170 | $710 | $2,460 |
| 2016 | $169 | $3,170 | $0 | $0 |
| 2015 | -- | $3,170 | $0 | $0 |
| 2012 | -- | $3,170 | $0 | $0 |
Source: Public Records
Map
Nearby Homes
- TBD Hidden Oaks
- 0 Shaw Rd
- 89 Frank Rd
- 1464 N Oak St
- 225 Missouri 87
- 1007 E Lawson Ave
- 109 W Haynes St
- 207 Greenwich Ave
- 205 Greenwich Ave
- 204 W Jemphrey Rd
- 508 E Harrison St
- 107 Lynn Ave
- 406 N Mill St
- 101 Industrial Dr
- 407 E Newton St
- 207 Franklin Ave
- 612 E High St
- LOT 5 SE View St
- LOT 3 SE View St
- LOT 4 SE View St
Your Personal Tour Guide
Ask me questions while you tour the home.